Click to Enlarge.
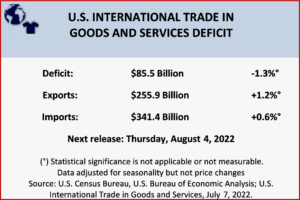
The US Census Bureau and the US Bureau of Economic Analysis said today that the goods and services deficit was $85.5 billion in May, down $1.1 billion from $86.7 billion in April, revised. May exports were $255.9 billion, $3.0 billion more than April exports. May imports were $341.4 billion, $1.9 billion more than April imports.
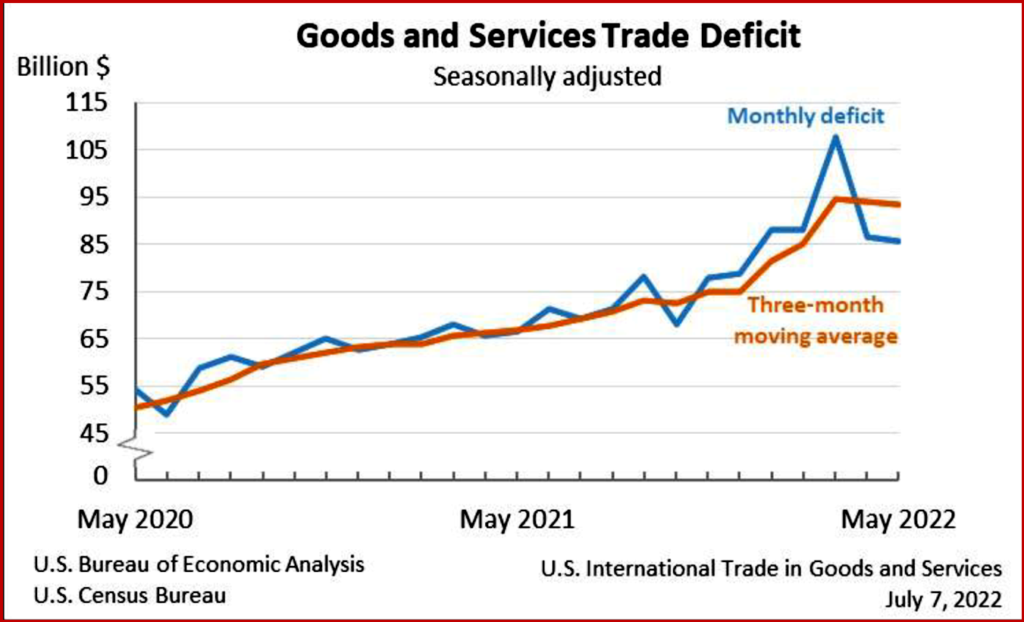
The May decrease in the goods and services deficit reflected a decrease in the goods deficit of $2.9 billion to $105.0 billion and a decrease in the services surplus of $1.7 billion to $19.4 billion. The average goods and services deficit decreased $0.9 billion to $93.3 billion for the three months ending in May.

Click to Enlarge.
Year-to-date, the goods and services deficit increased $126.5 billion, or 38.4%, from the same period in 2021. Exports increased $197.1 billion or 19.4%. Imports increased $323.6 billion or 24.0%.
Goods by Selected Countries,
The May figures show surpluses, in billions of dollars, with South and Central America ($7.1), Netherlands ($2.5), Hong Kong ($2.0), United Kingdom ($1.6), Brazil ($1.5), Singapore ($1.4), Belgium ($1.1), and Australia ($1.0). Deficits were recorded, in billions of dollars, with China ($32.2), European Union ($17.1), Vietnam ($11.1), Mexico ($9.9), Canada ($9.8), Germany ($6.1), Ireland ($6.0), Japan ($5.9), South Korea ($4.1), Taiwan ($3.9), Italy ($3.8), India ($3.7), Malaysia ($2.9), Switzerland ($1.9), Saudi Arabia ($1.4), France ($0.6), and Israel ($0.4).
- The deficit with China decreased $2.8 billion to $32.2 billion in May. Exports increased $0.5 billion to $12.5 billion and imports decreased $2.3 billion to $44.7 billion.
- The deficit with Mexico decreased $1.6 billion to $9.9 billion in May. Exports increased $0.8 billion to $28.7 billion and imports decreased $0.7 billion to $38.6 billion.
- The deficit with Canada increased $0.9 billion to $9.8 billion in May. Exports decreased $1.1 billion to $29.5 billion and imports decreased $0.2 billion to $39.3 billion.
Inevitable Footnotes
All statistics referenced are seasonally adjusted; statistics are on a balance of payments basis unless otherwise specified. Additional statistics, including not seasonally adjusted statistics and details for goods on a Census basis, are available in Exhibits 1-20b. For information on data sources, definitions, and revision procedures, see the explanatory notes in this release. The full release can be found at www.census.gov/foreign-trade/Press-Release/current press release/index.html or www.bea.gov/data/intl-trade-investment/international-trade-goods-and-services.

About Ken Zino
Ken Zino, editor and publisher of AutoInformed, is a versatile auto industry participant with global experience spanning decades in print and broadcast journalism, as well as social media. He has automobile testing, marketing, public relations and communications experience. He is past president of The International Motor Press Assn, the Detroit Press Club, founding member and first President of the Automotive Press Assn. He is a member of APA, IMPA and the Midwest Automotive Press Assn.
He also brings an historical perspective while citing their contemporary relevance of the work of legendary auto writers such as Ken Purdy, Jim Dunne or Jerry Flint, or writers such as Red Smith, Mark Twain, Thomas Jefferson – all to bring perspective to a chaotic automotive universe.
Above all, decades after he first drove a car, Zino still revels in the sound of the exhaust as the throttle is blipped during a downshift and the driver’s rush that occurs when the entry, apex and exit points of a turn are smoothly and swiftly crossed. It’s the beginning of a perfect lap.
AutoInformed has an editorial philosophy that loves transportation machines of all kinds while promoting critical thinking about the future use of cars and trucks.
Zino builds AutoInformed from his background in automotive journalism starting at Hearst Publishing in New York City on Motor and MotorTech Magazines and car testing where he reviewed hundreds of vehicles in his decade-long stint as the Detroit Bureau Chief of Road & Track magazine. Zino has also worked in Europe, and Asia – now the largest automotive market in the world with China at its center.


US International Trade Deficit Decreased in May 2022
Click to Enlarge.
The US Census Bureau and the US Bureau of Economic Analysis said today that the goods and services deficit was $85.5 billion in May, down $1.1 billion from $86.7 billion in April, revised. May exports were $255.9 billion, $3.0 billion more than April exports. May imports were $341.4 billion, $1.9 billion more than April imports.
The May decrease in the goods and services deficit reflected a decrease in the goods deficit of $2.9 billion to $105.0 billion and a decrease in the services surplus of $1.7 billion to $19.4 billion. The average goods and services deficit decreased $0.9 billion to $93.3 billion for the three months ending in May.
Click to Enlarge.
Year-to-date, the goods and services deficit increased $126.5 billion, or 38.4%, from the same period in 2021. Exports increased $197.1 billion or 19.4%. Imports increased $323.6 billion or 24.0%.
Goods by Selected Countries,
The May figures show surpluses, in billions of dollars, with South and Central America ($7.1), Netherlands ($2.5), Hong Kong ($2.0), United Kingdom ($1.6), Brazil ($1.5), Singapore ($1.4), Belgium ($1.1), and Australia ($1.0). Deficits were recorded, in billions of dollars, with China ($32.2), European Union ($17.1), Vietnam ($11.1), Mexico ($9.9), Canada ($9.8), Germany ($6.1), Ireland ($6.0), Japan ($5.9), South Korea ($4.1), Taiwan ($3.9), Italy ($3.8), India ($3.7), Malaysia ($2.9), Switzerland ($1.9), Saudi Arabia ($1.4), France ($0.6), and Israel ($0.4).
Inevitable Footnotes
All statistics referenced are seasonally adjusted; statistics are on a balance of payments basis unless otherwise specified. Additional statistics, including not seasonally adjusted statistics and details for goods on a Census basis, are available in Exhibits 1-20b. For information on data sources, definitions, and revision procedures, see the explanatory notes in this release. The full release can be found at www.census.gov/foreign-trade/Press-Release/current press release/index.html or www.bea.gov/data/intl-trade-investment/international-trade-goods-and-services.
About Ken Zino
Ken Zino, editor and publisher of AutoInformed, is a versatile auto industry participant with global experience spanning decades in print and broadcast journalism, as well as social media. He has automobile testing, marketing, public relations and communications experience. He is past president of The International Motor Press Assn, the Detroit Press Club, founding member and first President of the Automotive Press Assn. He is a member of APA, IMPA and the Midwest Automotive Press Assn. He also brings an historical perspective while citing their contemporary relevance of the work of legendary auto writers such as Ken Purdy, Jim Dunne or Jerry Flint, or writers such as Red Smith, Mark Twain, Thomas Jefferson – all to bring perspective to a chaotic automotive universe. Above all, decades after he first drove a car, Zino still revels in the sound of the exhaust as the throttle is blipped during a downshift and the driver’s rush that occurs when the entry, apex and exit points of a turn are smoothly and swiftly crossed. It’s the beginning of a perfect lap. AutoInformed has an editorial philosophy that loves transportation machines of all kinds while promoting critical thinking about the future use of cars and trucks. Zino builds AutoInformed from his background in automotive journalism starting at Hearst Publishing in New York City on Motor and MotorTech Magazines and car testing where he reviewed hundreds of vehicles in his decade-long stint as the Detroit Bureau Chief of Road & Track magazine. Zino has also worked in Europe, and Asia – now the largest automotive market in the world with China at its center.