
Click for more.
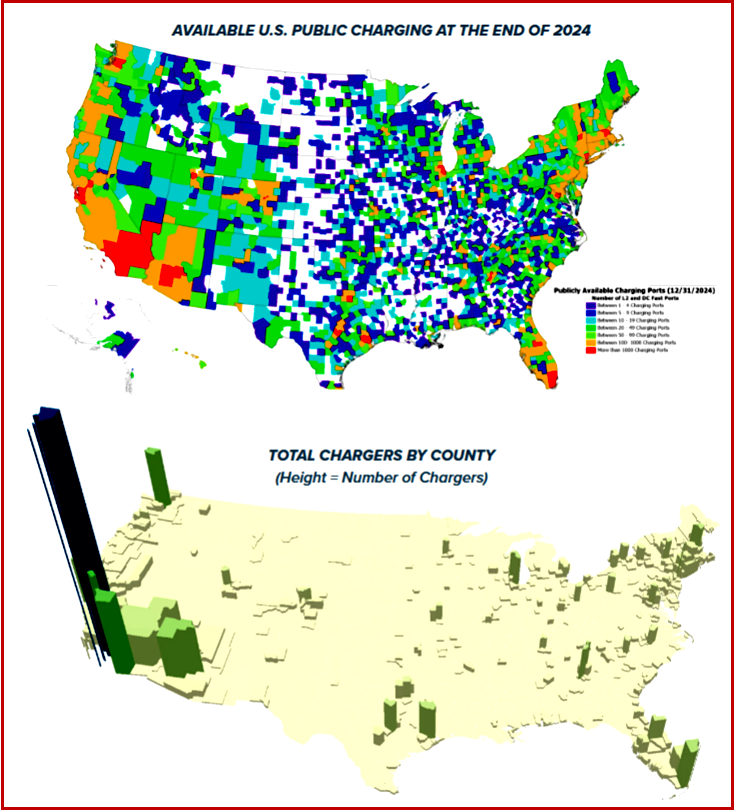
Geographic Distribution of Charging Infrastructure
At the end of 2024, there were ~195,000 public charging ports across the country and 5.8 million EVs on the road, a ratio of 30 EVs per charger. “While progress has been made installing public charging across the country, disparities persist. At the end of 2023, 31% of all U.S. counties had zero chargers installed. At the end of 2024, that number was 27 % (854 counties with NO public charging). Counties with five or fewer charging ports account for 41% of all counties. That number is an improvement from 2023 at 53 %. The top 25 counties with the most public charging ports installed accounted for nearly one-third of all available U.S. Charging (61,569 ports). At the end of 2024, 44 % of counties had No DC Fast charging installed. Next 6 % of counties had access to only 1 port. California is home to 26% of all DC Fast ports,” The Alliance said.
• In Q4 2024, the number of publicly available EV chargers increased 5 % from Q3 2024 – while total EVs on the road increased 7%.
• Nationwide, 433,843 EVs were registered in Q4 2024 but only 9701 new public chargers were added – a ratio of 45 new EVs for every new public port.
• There are 5.8 million EVs on the road (2 % of vehicles in operation – a new high) and a total of 194,824 publicly available charging outlets in the U.S. – a ratio of 30 EVs for every public port.
• Half of all registered EVs are located in just 41 counties.
• 27% of counties had no access to public charging.
