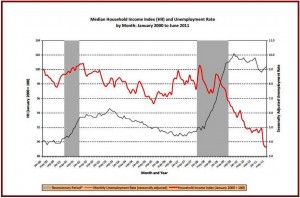
During the recession, real median annual household income fell by 3.2%, from $55,309 in December 2007 to $53,518 in June 2009. During the “economic recovery,” real median annual household income fell by an additional 6.7%, from $53,518 in June 2009 to $49,909 in June 2011.
“Says who?”
That might be the new slogan for voters during the upcoming election when incumbents will face tough questions from beleaguered citizens about an allegedly improving economy. It’s certainly an apt question according to a new survey about household income released this morning.
The survey showed real median annual household income has fallen significantly more during the so called economic recovery period from June 2009 to June 2011 than during the recession lasting from December 2007 to June 2009. That’s right, not only do we a jobless recovery, but we have one where household income is dropping. Since when are politicians in the business of making people poorer in a grim reversal of the American Dream?
The household incomes data are from Sentier Research that introduces a new monthly series examining trends in the income (before taxes) of American households. This new series supplements existing statistical series such as the employment and unemployment data released monthly by the U.S. Bureau of Labor Statistics.
The report is bad news for the auto industry, which remains in a severe slump caused in part by record high new car prices – now averaging more than $30,000 a vehicle, and projections of even higher prices to come because of new emissions and safety regulations.
In a release, Sentier said it will provide the only measure of changes in household income from now until the fall of 2012 when the U.S. Census Bureau will issue its report for income and poverty in calendar year 2011. The authors of the new report are Gordon Green and John Coder, both former officials at the U.S. Census Bureau.
Among today’s other findings:
- During the recession, real median annual household income fell by 3.2%, from $55,309 in December 2007 to $53,518 in June 2009. During the “economic recovery,” real median annual household income fell by an additional 6.7%, from $53,518 in June 2009 to $49,909 in June 2011.
- For the entire period from December 2007 to June 2011, real median annual household income has declined by 9.8%. A decline of this magnitude represents a significant reduction in the American standard of living.
The report also looks at changes in real median annual household income during the alleged “economic recovery” (from June 2009 to June 2011) for key demographic, social, and economic groups.
During this period income declined for all but a few groups in the population, and some of the largest declines occurred for groups with incomes well below the overall median annual household income.
Highlights of the income declines between June 2009 and June 2011 include:
- Real median annual household income for family households with a male or female head and no spouse present (many with children in the household) declined by 7.3% (from $39,321 to $36,465) compared to a decline for married-couple households of 4.5% (from $76,783 to $73,324).
- Real median annual household income for households with a head under 25 years old declined by 9.5% (from $32,123 to $29,060) compared to a decline for households with a head 45 to 54 years old of 5.5% (from $65,911 to $62,315).
- Real median annual household income for households with a head looking for work or on layoff (unemployed) declined by 18.4% (from $41,037 to $33,487) compared to a decline for households with a head working full-time of 5.1% (from $72,104 to $68,454).
- Real median annual household income for households with a Black (not Hispanic) head declined by 9.4% (from $35,072 to $31,784) compared to a decline for households with a White (not Hispanic) head of 4.7% (from $59,111 to $56,320). The decline for households with a Hispanic head was 4.9% (from $41,945 to $39,901).
The report also releases Sentier Research’s new index number called the Household Income Index (HII) to track monthly changes in real median annual household income over time. Using January 2000 as the starting point, with the HII set equal to 100.0, the value of the index in each subsequent month shows household income measured as percentage of the January 2000 base value.
- The most recent value for the index was 89.4 for June 2011, down from the January 2000 base of 100.0 (the lowest value for the index was 89.3 registered in May 2011).
- Looking back to January 2000, the HII has risen above 100.0 in only nine of the 138 months covered by the series so far. The highest index value was 100.8 occurring in February 2002. With a few exceptions, the HII has declined each month since December 2008.
- Declines in the HII during both the recession and the economic recovery have been highly correlated with high levels of unemployment, increases in the duration of unemployment, and the large number of persons who have experienced “employment hardship” (currently unemployed persons, marginally attached or discouraged workers, and those currently working part-time for economic reasons).
The estimates in the report are based on the Current Population Survey (CPS), the monthly household survey that provides official estimates of the unemployment rate. The CPS samples approximately 50,000 households and 130,000 household members each month. As is the case with all surveys, the estimates are subject to sampling and non-sampling errors. All comparisons made in the report have been tested and found to be statistically significant at the 90% confidence level, unless otherwise noted.
Copies of the report, Household Income Trends During the Recession and Economic Recovery (23 pages as .pdf), issued in September 2011, can be obtained from the Sentier Research website at www.sentierresearch.com for a price of $20.

