The Trump (non-) administration – with both the Commander in Chief and his appointees under investigation for collaborating with Russian interference in a presidential election, among other illegal acts such as collusion with foreign governments — is on track for the U.S. to post the largest deficits in its history. The ‘Make America Great Again” demagogue – or is that make America’s middle class poor – will accomplish this despite his campaign promises not to cut Social Security and Medicare. (We wonder if he will ask for immunity from prosecution on those?) Another huge problem is runaway defense spending under Trump.
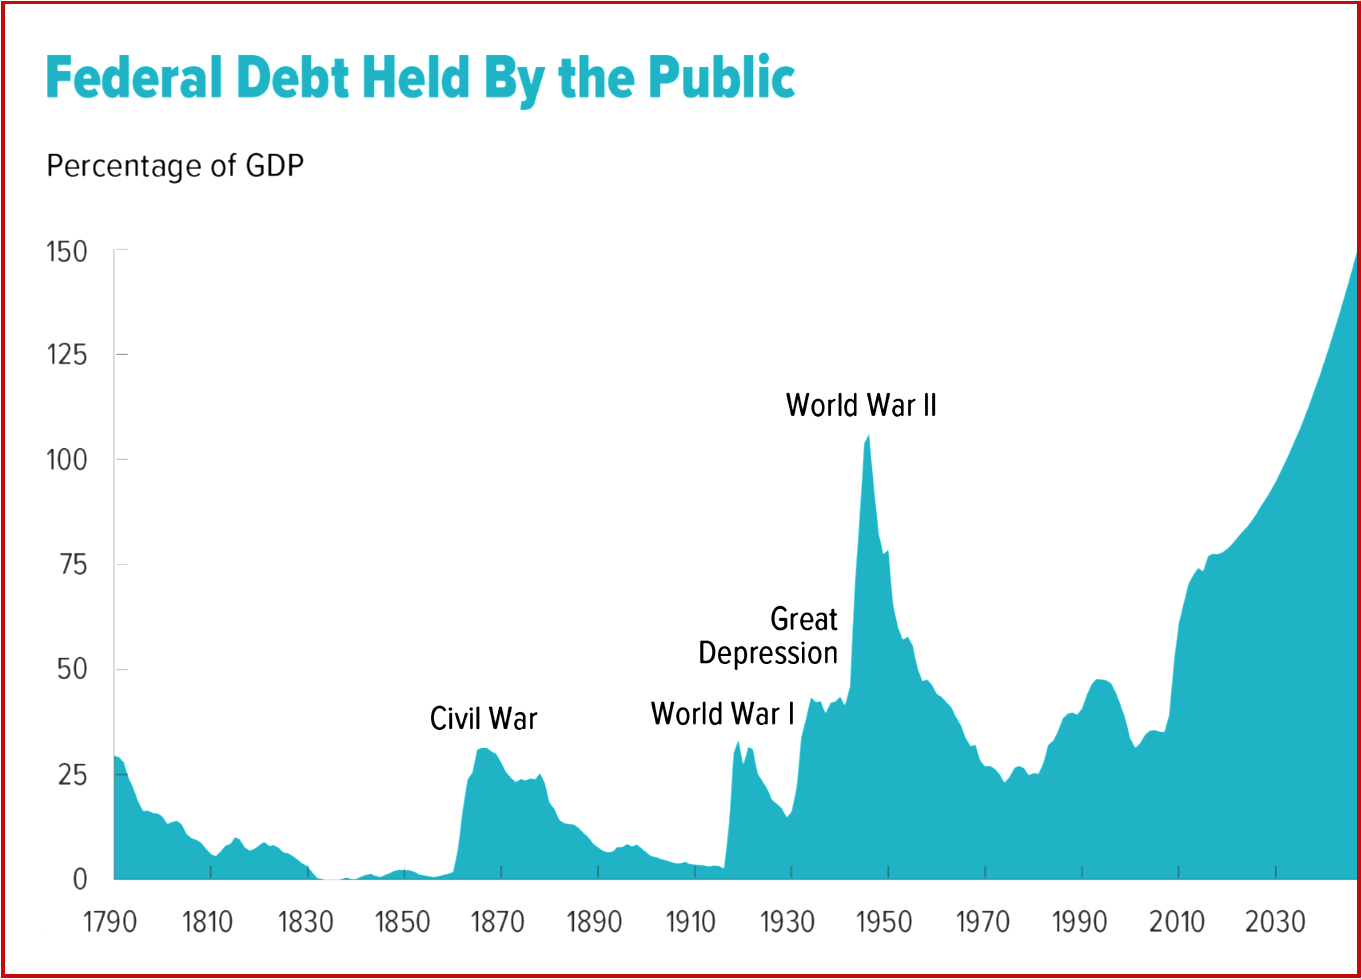
At 77 % of gross domestic product (GDP), federal debt held by the public is now at its highest level since the end of World War II. The Congressional Budget Office in an extremely detailed report concludes that despite considerable uncertainty of long-term projections, debt as a percentage of GDP would probably be greater – likely, much greater – than it is today if current laws remained generally unchanged.
As it stands now, if current laws governing taxes and spending remained generally the same, debt would nearly double as a percentage of GDP over the next 30 years, according to CBO’s chief estimate. That projection is uncertain, however, so the agency examined in detail how debt would change if four key inputs:
- labor force participation,
- productivity in the economy,
- interest rates on federal debt, and
- health care costs per person—were higher or lower than their levels in the extended baseline.
Other factors—such as a depression, a major war, or unexpected changes in fertility, immigration, or mortality rates—also could affect debt. Considering a range of uncertainty around CBO’s central projections of those four key inputs.
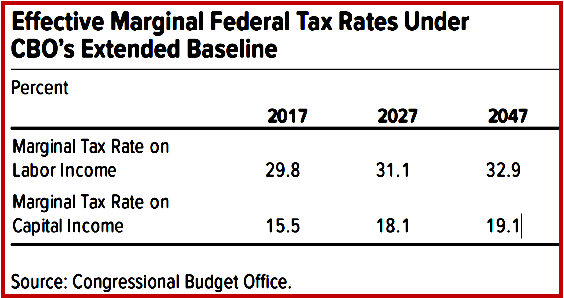
Middle class gets Nailed on Marginal Tax Rates
 Troubling are the marginal tax rates that show you who is really running U.S. fiscal policies – hint, it’s the private jet set and not the average American. Right now, marginal tax rates are shockingly unequal.
The Status Quo
If current laws generally remained unchanged, CBO projects, growing budget deficits would boost that debt sharply over the next 30 years. During that period, federal spending for:
- Retirement benefits and health care programs that benefit older people would increase substantially. As the population ages, outlays for Social Security and Medicare will rise as a percentage of GDP because of the increasing number of beneficiaries for those programs and because of rising health care costs per beneficiary.
- In addition, the government’s interest costs would increase because of rising interest rates and higher federal debt. The growth in spending would outpace growth in revenues, leading to larger budget deficits as a share of the nation’s total economic output—its GDP. As a result, CBO projects, federal debt held by the public would increase, reaching 89 % of GDP by 2027.
- Two decades later, in 2047, debt would reach 150 % of GDP, the highest level in the nation’s history.
What Changes in Spending, Revenues to Reach Goals for Federal Debt?
CBO estimated the magnitude of changes that would be needed to achieve a chosen goal for federal debt. For example, if lawmakers wanted to reduce the amount of debt in 2047 to 40% of GDP, its average over the past 50 years, they might cut non-interest spending, increase revenues, or take a combination of both approaches to make changes that equal 3.1% of GDP each year starting in 2018.
That amount would total a staggering ~$620 billion in 2018. If, instead, policymakers wanted debt in 2047 to equal its current share of GDP (77%), the necessary measures would be smaller, totaling 1.9% of GDP per year (about $380 billion in 2018). The longer lawmakers waited to act, of course – and a likely scenario in AutoInformed’s view – the larger the necessary policy changes would become.
CBOs extended baseline generally reflects current law, following CBO’s 10-year baseline budget projections through 2027 and then extending most of the concepts underlying those baseline projections for the rest of the long-term projection period.
Outlays for the major health care programs consist of gross spending for Medicare (which does not account for offsetting receipts that are credited to the program), Medicaid, and the Children’s Health Insurance Program, as well as outlays to subsidize health insurance purchased through the marketplaces established under the Affordable Care Act (now that the American Care Act is dead) and related spending.
So-called excess cost growth is how the growth rate of nominal health care spending per capita—adjusted for demographic characteristics of the relevant populations – exceeds the growth rate of potential gross domestic product per capita. (Potential gross domestic product is the maximum sustainable output of the economy.) This highlights the most important effects of aging and excess cost growth. Other effects, such as the effect of aging on the number of Social Security Disability Insurance beneficiaries, are smaller.
Uncertainty in Long-Term Projections
If future tax and spending policies did not vary from those specified in current law, the budgetary would differ from those in CBO’s baseline projections because of unexpected changes in the economy, demographics, and other factors.


Pingback: US Deficit and Government Spending Grow in Q2 | AutoInformed