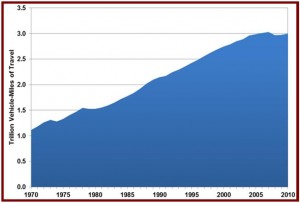
The better the economy and the lower the price of fuel, the more miles traveled.
Preliminary estimates from the Federal Highway Administration show that vehicle miles traveled (VMT) increased slightly in 2010 over the previous year.
However VMT has not surpassed the peak of 3.03 trillion miles in 2007 when the economy was booming and gasoline was relatively inexpensive.
Total U.S. VMT declined during the economic downturns in the mid-1970’s, early 1980’s, and in 2008, of course, when the U.S. economy entered its largest economic crisis since the Great Depression.
Despite all the political blather about “energy independence going back to the Nixon administration, , the U.S. still remains hostage to imported oil and corrupt governments.
Total Vehicle-Miles of Travel, 1970-2010
| Total Vehicle-Miles of Travel, 1970-2010 |
| Year |
Trillion Miles |
Year |
Trillion Miles |
|
| 1970 |
1.11 |
1991 |
2.17 |
|
| 1971 |
1.18 |
1992 |
2.25 |
|
| 1972 |
1.26 |
1993 |
2.30 |
|
| 1973 |
1.31 |
1994 |
2.36 |
|
| 1974 |
1.28 |
1995 |
2.42 |
|
| 1975 |
1.33 |
1996 |
2.49 |
|
| 1976 |
1.40 |
1997 |
2.56 |
|
| 1977 |
1.47 |
1998 |
2.63 |
|
| 1978 |
1.54 |
1999 |
2.69 |
|
| 1979 |
1.53 |
2000 |
2.75 |
|
| 1980 |
1.53 |
2001 |
2.79 |
|
| 1981 |
1.56 |
2002 |
2.86 |
|
| 1982 |
1.60 |
2003 |
2.89 |
|
| 1983 |
1.65 |
2004 |
2.96 |
|
| 1984 |
1.72 |
2005 |
2.99 |
|
| 1985 |
1.77 |
2006 |
3.01 |
|
| 1986 |
1.83 |
2007 |
3.03 |
|
| 1987 |
1.92 |
2008 |
2.97 |
|
| 1988 |
2.03 |
2009 |
2.98 |
|
| 1989 |
2.10 |
2010 |
3.00 |
|
| 1990 |
2.14 |
|
|
|
Sources: 1970-2008: U.S. Department of Transportation, Federal Highway Administration, Highway Statistics Series.
2009-2010: U.S. Department of Transportation, Federal Highway Administration, Traffic Volume Trends. |
|

About Ken Zino
Ken Zino, editor and publisher of AutoInformed, is a versatile auto industry participant with global experience spanning decades in print and broadcast journalism, as well as social media. He has automobile testing, marketing, public relations and communications experience. He is past president of The International Motor Press Assn, the Detroit Press Club, founding member and first President of the Automotive Press Assn. He is a member of APA, IMPA and the Midwest Automotive Press Assn.
He also brings an historical perspective while citing their contemporary relevance of the work of legendary auto writers such as Ken Purdy, Jim Dunne or Jerry Flint, or writers such as Red Smith, Mark Twain, Thomas Jefferson – all to bring perspective to a chaotic automotive universe.
Above all, decades after he first drove a car, Zino still revels in the sound of the exhaust as the throttle is blipped during a downshift and the driver’s rush that occurs when the entry, apex and exit points of a turn are smoothly and swiftly crossed. It’s the beginning of a perfect lap.
AutoInformed has an editorial philosophy that loves transportation machines of all kinds while promoting critical thinking about the future use of cars and trucks.
Zino builds AutoInformed from his background in automotive journalism starting at Hearst Publishing in New York City on Motor and MotorTech Magazines and car testing where he reviewed hundreds of vehicles in his decade-long stint as the Detroit Bureau Chief of Road & Track magazine. Zino has also worked in Europe, and Asia – now the largest automotive market in the world with China at its center.


