Click for more data.
The unemployment rate* in the U.S. transportation sector was 4.8% (not seasonally adjusted) in October 2023 according to Bureau of Labor Statistics (BLS). In October 2023, the transportation sector unemployment rate rose 1.1 percentage points from 3.7% in October 2022 and was above the pre-pandemic October 2019 level of 2.7% but still below the October 2020 and October 2021 rates. Unemployment in the transportation sector reached its highest level during the COVID-19 pandemic (15.7%) in May 2020 and July 2020.
Seasonally adjusted, employment in the transportation and warehousing sector fell to 6,686,200 in October 2023 – down 0.2% from the previous month and down 0.8% from October 2022. Employment in transportation and warehousing grew 16.9% in October 2023 from the pre-pandemic October 2019 level of 5,717,900.
By mode (seasonally adjusted):
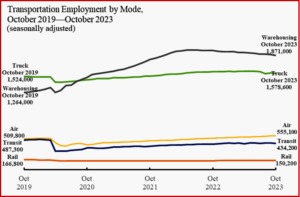
- Air transportation rose to 555,100 in October 2023 — up 0.6% from the previous month and up 7.4% from October 2022.
- Truck transportation fell to 1,578,600 in October 2023 — down 0.3% from the previous month and down 1.7% from October 2022.
- Transit and ground passenger transportation fell to 434,200 in October 2023 — down 0.2% from the previous month but up 4.1% from October 2022.
- Rail transportation remained virtually unchanged in October 2023 at 150,200 from the previous month but up 1.8% from October 2022.
- Water transportation rose to 70,300 in October 2023 — up 1.7% from the previous month and up 6.2% from October 2022.
- Pipeline transportation fell to 48,000 in October 2023 — down 1.0% from the previous month and down 0.2% from October 2022.
- Warehousing and storage fell to 1,871,000 in October 2023 — down 0.6% from the previous month and down 4.0% from October 2022.
All-time highs (seasonally adjusted) with records beginning in 1990: air March 2001 (633,600); pipeline July 1991 (61,200); rail January 1990 (278,100); transit June 2019 (503,800); truck January 2023 (1,611,400); warehousing and storage June 2022 (1,960,300); and water October 2023 (70,300)
*The unemployment rate is the total number of unemployed persons, expressed as a percentage of the civilian labor force. The civilian labor force includes all persons aged 16 and older who are employed and unemployed – meaning they are either currently working or actively looking for work.
- Unemployed persons include those who actively sought a job within the last four weeks.
- People waiting to start a new job who have not actively sought a job in the last four weeks are not counted as employed or unemployed; they are considered to be out of the labor force.
- An unemployed person’s industry is the industry for the last job they held in the workforce, which may or may not reflect their current job search field or industry.

About Ken Zino
Ken Zino, editor and publisher of AutoInformed, is a versatile auto industry participant with global experience spanning decades in print and broadcast journalism, as well as social media. He has automobile testing, marketing, public relations and communications experience. He is past president of The International Motor Press Assn, the Detroit Press Club, founding member and first President of the Automotive Press Assn. He is a member of APA, IMPA and the Midwest Automotive Press Assn.
He also brings an historical perspective while citing their contemporary relevance of the work of legendary auto writers such as Ken Purdy, Jim Dunne or Jerry Flint, or writers such as Red Smith, Mark Twain, Thomas Jefferson – all to bring perspective to a chaotic automotive universe.
Above all, decades after he first drove a car, Zino still revels in the sound of the exhaust as the throttle is blipped during a downshift and the driver’s rush that occurs when the entry, apex and exit points of a turn are smoothly and swiftly crossed. It’s the beginning of a perfect lap.
AutoInformed has an editorial philosophy that loves transportation machines of all kinds while promoting critical thinking about the future use of cars and trucks.
Zino builds AutoInformed from his background in automotive journalism starting at Hearst Publishing in New York City on Motor and MotorTech Magazines and car testing where he reviewed hundreds of vehicles in his decade-long stint as the Detroit Bureau Chief of Road & Track magazine. Zino has also worked in Europe, and Asia – now the largest automotive market in the world with China at its center.


Mixed Signals in October US Transportation Employment
Click for more data.
The unemployment rate* in the U.S. transportation sector was 4.8% (not seasonally adjusted) in October 2023 according to Bureau of Labor Statistics (BLS). In October 2023, the transportation sector unemployment rate rose 1.1 percentage points from 3.7% in October 2022 and was above the pre-pandemic October 2019 level of 2.7% but still below the October 2020 and October 2021 rates. Unemployment in the transportation sector reached its highest level during the COVID-19 pandemic (15.7%) in May 2020 and July 2020.
Seasonally adjusted, employment in the transportation and warehousing sector fell to 6,686,200 in October 2023 – down 0.2% from the previous month and down 0.8% from October 2022. Employment in transportation and warehousing grew 16.9% in October 2023 from the pre-pandemic October 2019 level of 5,717,900.
By mode (seasonally adjusted):
All-time highs (seasonally adjusted) with records beginning in 1990: air March 2001 (633,600); pipeline July 1991 (61,200); rail January 1990 (278,100); transit June 2019 (503,800); truck January 2023 (1,611,400); warehousing and storage June 2022 (1,960,300); and water October 2023 (70,300)
*The unemployment rate is the total number of unemployed persons, expressed as a percentage of the civilian labor force. The civilian labor force includes all persons aged 16 and older who are employed and unemployed – meaning they are either currently working or actively looking for work.
About Ken Zino
Ken Zino, editor and publisher of AutoInformed, is a versatile auto industry participant with global experience spanning decades in print and broadcast journalism, as well as social media. He has automobile testing, marketing, public relations and communications experience. He is past president of The International Motor Press Assn, the Detroit Press Club, founding member and first President of the Automotive Press Assn. He is a member of APA, IMPA and the Midwest Automotive Press Assn. He also brings an historical perspective while citing their contemporary relevance of the work of legendary auto writers such as Ken Purdy, Jim Dunne or Jerry Flint, or writers such as Red Smith, Mark Twain, Thomas Jefferson – all to bring perspective to a chaotic automotive universe. Above all, decades after he first drove a car, Zino still revels in the sound of the exhaust as the throttle is blipped during a downshift and the driver’s rush that occurs when the entry, apex and exit points of a turn are smoothly and swiftly crossed. It’s the beginning of a perfect lap. AutoInformed has an editorial philosophy that loves transportation machines of all kinds while promoting critical thinking about the future use of cars and trucks. Zino builds AutoInformed from his background in automotive journalism starting at Hearst Publishing in New York City on Motor and MotorTech Magazines and car testing where he reviewed hundreds of vehicles in his decade-long stint as the Detroit Bureau Chief of Road & Track magazine. Zino has also worked in Europe, and Asia – now the largest automotive market in the world with China at its center.