The election of Donald Trump as U.S. president has implications for the auto industry, but are they good are bad? Trump singled out Ford and General Motors during the campaign for their investments in Mexico, rather than the U.S. Furthermore, the Detroit Three in the just completed Canadian auto talks all agreed to new investments in a contract that covers Trump’s term. (Unifor Autoworkers Ratify Ford Canada Contract)
NAFTA is the biggest issue here. Many automakers already produce in Mexico. There are expansion plans from existing Mexican producers and new plant capacity from BMW (San Luis Potosi) and Daimler (JV with Infiniti in Aguascalientes ~2019). Ford’s plans for Small and Compact cars are aimed at start of production in 2018 (San Luis Potosi). Toyota is due to start building the Corolla in 2019 (Guanajuato). Hyundai’s expansion in Monterrey is already under way, but future models could be impacted.
Compounding this, roughly 2 million vehicles made in the U.S. are exported annually. If NAFTA falls apart and the exports stop that’s roughly the equivalent of 10 final assembly plans shutting down, and that doesn’t include the U.S. plants of suppliers.
Consultancy LMC Automotive with Oxford Economics believe that the election of Trump can negatively impact the Light Vehicle industry in two ways. It’s just a question of degree:
First, “negative macroeconomic consequences could weigh on US and global growth, diminishing vehicle demand and reducing vehicle output from the top down.”
Second, trade within “NAFTA could be distorted if barriers (tariff or other) were to be imposed with the most negative risks evident for future Mexican vehicle production volume and sourcing decisions.” Complications in the supply chain – that no politician understands – could then ensue.
Consider that automakers and component manufacturers are already heavily invested in Mexico now confront very different business conditions than those prevailing, and just as importantly – assumed for the future. LMC says that uncertainty over future geographical/sourcing decisions is now high, at least until detailed policy proposals are brought forward.
However, countering the negatives could be the promised tax cuts and other incentives promoting investment in the U.S. for OEMs and suppliers. In addition, there is the growing possibility that CAFE regulations will be relaxed, which may ease concerns that the targets will are too challenging to achieve, thinks LMC.
The crucial question – and unknown – is to what extent campaign rhetoric translates into real policy decisions under a Trump administration. In gridlocked Washington, this won’t be known for, well, who knows how long?
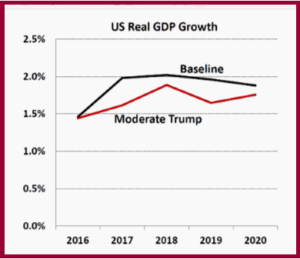
Moderate Trump
 The Moderate Trump scenario involves only partial implementation of various campaign policies, which would likely lead to negative consequences for US economic growth. Under this scenario:
- Limited tariffs are applied to Mexico and China, increasing prices for US consumers, though retaliatory measures also hit US exporters.
- Initially a tax cut policy is supportive of growth but could turn negative as government spending is cut to finance this policy.
- Stronger immigration controls, and possible deportations, are also enacted, with some near-term consequences for domestic demand, though this may also play out over a long period.
LMC says the overall effect is “relatively muted” and, once the immediate effects of trade and immigration pass, the economy recovers, though it remains permanently below the pre-existing base case.
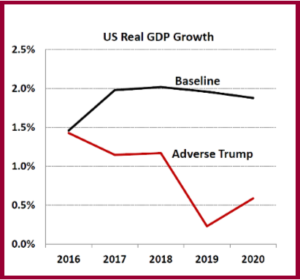
Adverse Trump
 The Adverse Trump scenario assumes that many, though not all, of the campaign policies are implemented:
- The resulting slowdown in the US economy, and declining trade flows between several of the world’s largest economies, has far-reaching consequences around the globe.
- More punitive tariffs on Mexican and Chinese goods, which is ultimately extended to other countries. A strong retaliatory response is expected.
- Tax cuts are introduced more quickly than under the Moderate Trump scenario. Government spending would have to be reduced, hurting GDP growth.
- Deportation of illegal immigrants and stronger curbs on immigration are also enacted, further reducing domestic demand and potential supply, adding to future inflationary pressures.
- The US economy would be reduced by -5%, relative to the current base case, under this scenario by 2021. Global output would also be hit, by -2%, under the same assumptions.
Under the Moderate Trump or Adverse Trump Light Vehicle Sales would be negatively affected. The largest impact on any single market is in the U.S. Small reductions in many other markets represent a significant loss to rest-of-world (RoW) markets, per LMC. Effects are not dramatic for the industry. The U.S. market is hit harder by economic effects, but RoW markets also suffer significant losses relative to the base case “as weak US economic activity combines with trade frictions and confidence effects.”
Moderate Trump
Vehicle Sales in Millions
U.S. RoW
Baseline M Trump Chg. Base M Trump
2016 17.45 17.44 -0.01 75.6 75.6 -0.04
2017 17.45 17.24 -0.21 76.9 76.6 -0.23
2018 17.47 17.21 -0.26 79.5 79.1 -0.41
2019 17.50 17.12 -0.38 83.0 82.5 -0.58
2020 17.59 17.26 -0.33 85.6 85.0 -0.61
2021 17.72 17.48 -0.24 88.5 87.9 -0.58
Adverse Trump
U.S. RoW
Vehicle Sales in Millions
Baseline A Trump Chg. Base A Trump
2016 17.45 17.43 -0.01 75.6 75.6 -0.05
2017 17.45 17.04 -0.41 76.9 76.4 -0.51
2018 17.47 16.68 -0.79 79.5 78.4 -1.16
2019 17.50 16.40 -1.10 83.0 81.2 -1.82
2020 17.59 16.26 -1.33 85.6 83.2 -2.43
2021 17.72 16.51 -1.21 88.5 85.8 -2.66

