Pedestrians are projected to account for 16% of all traffic deaths in 2018, compared to 12% in 2008.
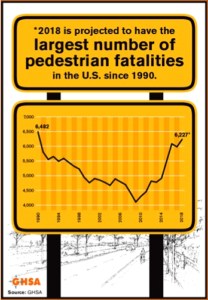
A new report from the Governors Highway Safety Association (GHSA) projects that 6,227 pedestrian fatalities occurred in 2018, the highest number in nearly three decades. States were asked to report pedestrian fatalities for the first six months of 2018. After adjusting this raw data based on historical trends, GHSA projects a 4% increase in the number of pedestrians killed during the full 2018 calendar year. In 2017, 5,977 people on foot lost their lives in motor vehicle crashes.
“While we have made progress reducing fatalities among many other road users in the past decade, pedestrian deaths have risen 35%,” said GHSA Executive Director Jonathan Adkins. “The alarm bells continue to sound on this issue; it’s clear we need to fortify our collective efforts to protect pedestrians and reverse the trend.”
GHSA’s annual “Spotlight on Highway Safety” is a first look at state and national trends in 2018 pedestrian traffic deaths, based on preliminary data provided by State Highway Safety Offices in all 50 states and the District of Columbia. Richard Retting of Sam Schwartz Consulting analyzed the data and authored the report.
 Pedestrians are projected to account for 16% of all traffic deaths in 2018, compared to 12% in 2008. While advancements in motor vehicle safety and technology have increased survivability for vehicle occupants involved in crashes, pedestrians remain just as susceptible to sustaining serious or fatal injuries when struck by a motor vehicle.
There are many causes behind the rise in pedestrian fatalities:
- More walking has increased exposure, as one survey estimated that the number of Americans walking to work in the past week increased about 4% between 2007 and 2016;
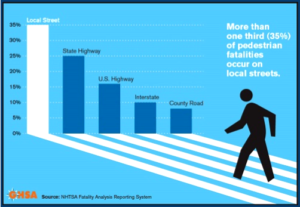
- Most pedestrian fatalities take place on local roads, at night, away from intersections, suggesting the need for safer road crossings. Over the past 10 years, nighttime crashes accounted for more than 90% of the total increase in pedestrian deaths;
- Many unsafe driving behaviors, such as speeding, distracted and drowsy driving, pose risks to pedestrians, and alcohol impairment by the driver and/or pedestrian was reported in about half of traffic crashes that resulted in pedestrian fatalities in 2017;
- The number of sport utility vehicles (SUVs) involved in pedestrian deaths has increased by 50% since 2013. By comparison, (non-SUV) passenger cars’ involvement in pedestrian fatalities increased by 30% over the same time period. Although passenger cars still account for most pedestrian deaths, SUVs – which generally cause more severe pedestrian injuries – make up an increasingly larger percentage of registered vehicles.
“Crossing the street should not be a death sentence,” said report author Richard Retting. “We have a range of proven infrastructure, engineering, and behavioral strategies that we know can reduce pedestrian deaths. Critical improvements to road and vehicle design are being made but take significant time and resources to implement. It is also important to conduct law enforcement and safety education campaigns now to ensure drivers and pedestrians can safely coexist. It’s crucial to do everything we can to protect pedestrians utilizing a broad approach.”
Despite the alarming projected increase in pedestrian deaths, the report identifies several promising lessons from state-reported data. For example, 23 states saw declines in pedestrian fatalities for the first half of 2018 compared to 2017, with six states reporting double-digit declines and three reporting consecutive years of declines. Additionally, sharp decreases in pedestrian fatalities in some cities suggest that state-level data may obscure local success stories.
In addition to examining pedestrian fatality crash characteristics, the report also discusses comprehensive strategies to reduce pedestrian and motor vehicle crashes, addressing promising infrastructural, educational and enforcement approaches. It also outlines specific examples from most states, such as: targeted law enforcement efforts; outreach in high-risk areas; pedestrian safety assessments and road safety audits; support for engineering efforts; and adoption of Complete Streets policies.
The full report, including state-by-state data and infographics, is available at ghsa.org/resources/Pedestrians19.

About Ken Zino
Ken Zino, editor and publisher of AutoInformed, is a versatile auto industry participant with global experience spanning decades in print and broadcast journalism, as well as social media. He has automobile testing, marketing, public relations and communications experience. He is past president of The International Motor Press Assn, the Detroit Press Club, founding member and first President of the Automotive Press Assn. He is a member of APA, IMPA and the Midwest Automotive Press Assn.
He also brings an historical perspective while citing their contemporary relevance of the work of legendary auto writers such as Ken Purdy, Jim Dunne or Jerry Flint, or writers such as Red Smith, Mark Twain, Thomas Jefferson – all to bring perspective to a chaotic automotive universe.
Above all, decades after he first drove a car, Zino still revels in the sound of the exhaust as the throttle is blipped during a downshift and the driver’s rush that occurs when the entry, apex and exit points of a turn are smoothly and swiftly crossed. It’s the beginning of a perfect lap.
AutoInformed has an editorial philosophy that loves transportation machines of all kinds while promoting critical thinking about the future use of cars and trucks.
Zino builds AutoInformed from his background in automotive journalism starting at Hearst Publishing in New York City on Motor and MotorTech Magazines and car testing where he reviewed hundreds of vehicles in his decade-long stint as the Detroit Bureau Chief of Road & Track magazine. Zino has also worked in Europe, and Asia – now the largest automotive market in the world with China at its center.


US Pedestrian Fatalities Highest Since 1990!
Pedestrians are projected to account for 16% of all traffic deaths in 2018, compared to 12% in 2008.
A new report from the Governors Highway Safety Association (GHSA) projects that 6,227 pedestrian fatalities occurred in 2018, the highest number in nearly three decades. States were asked to report pedestrian fatalities for the first six months of 2018. After adjusting this raw data based on historical trends, GHSA projects a 4% increase in the number of pedestrians killed during the full 2018 calendar year. In 2017, 5,977 people on foot lost their lives in motor vehicle crashes.
“While we have made progress reducing fatalities among many other road users in the past decade, pedestrian deaths have risen 35%,” said GHSA Executive Director Jonathan Adkins. “The alarm bells continue to sound on this issue; it’s clear we need to fortify our collective efforts to protect pedestrians and reverse the trend.”
GHSA’s annual “Spotlight on Highway Safety” is a first look at state and national trends in 2018 pedestrian traffic deaths, based on preliminary data provided by State Highway Safety Offices in all 50 states and the District of Columbia. Richard Retting of Sam Schwartz Consulting analyzed the data and authored the report.
There are many causes behind the rise in pedestrian fatalities:
“Crossing the street should not be a death sentence,” said report author Richard Retting. “We have a range of proven infrastructure, engineering, and behavioral strategies that we know can reduce pedestrian deaths. Critical improvements to road and vehicle design are being made but take significant time and resources to implement. It is also important to conduct law enforcement and safety education campaigns now to ensure drivers and pedestrians can safely coexist. It’s crucial to do everything we can to protect pedestrians utilizing a broad approach.”
Despite the alarming projected increase in pedestrian deaths, the report identifies several promising lessons from state-reported data. For example, 23 states saw declines in pedestrian fatalities for the first half of 2018 compared to 2017, with six states reporting double-digit declines and three reporting consecutive years of declines. Additionally, sharp decreases in pedestrian fatalities in some cities suggest that state-level data may obscure local success stories.
In addition to examining pedestrian fatality crash characteristics, the report also discusses comprehensive strategies to reduce pedestrian and motor vehicle crashes, addressing promising infrastructural, educational and enforcement approaches. It also outlines specific examples from most states, such as: targeted law enforcement efforts; outreach in high-risk areas; pedestrian safety assessments and road safety audits; support for engineering efforts; and adoption of Complete Streets policies.
The full report, including state-by-state data and infographics, is available at ghsa.org/resources/Pedestrians19.
About Ken Zino
Ken Zino, editor and publisher of AutoInformed, is a versatile auto industry participant with global experience spanning decades in print and broadcast journalism, as well as social media. He has automobile testing, marketing, public relations and communications experience. He is past president of The International Motor Press Assn, the Detroit Press Club, founding member and first President of the Automotive Press Assn. He is a member of APA, IMPA and the Midwest Automotive Press Assn. He also brings an historical perspective while citing their contemporary relevance of the work of legendary auto writers such as Ken Purdy, Jim Dunne or Jerry Flint, or writers such as Red Smith, Mark Twain, Thomas Jefferson – all to bring perspective to a chaotic automotive universe. Above all, decades after he first drove a car, Zino still revels in the sound of the exhaust as the throttle is blipped during a downshift and the driver’s rush that occurs when the entry, apex and exit points of a turn are smoothly and swiftly crossed. It’s the beginning of a perfect lap. AutoInformed has an editorial philosophy that loves transportation machines of all kinds while promoting critical thinking about the future use of cars and trucks. Zino builds AutoInformed from his background in automotive journalism starting at Hearst Publishing in New York City on Motor and MotorTech Magazines and car testing where he reviewed hundreds of vehicles in his decade-long stint as the Detroit Bureau Chief of Road & Track magazine. Zino has also worked in Europe, and Asia – now the largest automotive market in the world with China at its center.