Click for more information.
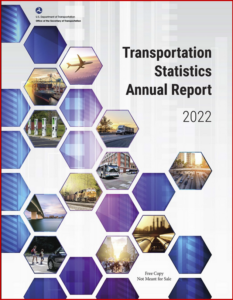
The Bureau of Transportation Statistics (BTS) released today the 28th edition of the Transportation Statistical Annual Report or TSAR.* Covered in the TSAR by legislative mandate are the State of the System; Passenger Travel and Equity; Freight and Supply Chain; Transportation Economics; Transportation Safety; Energy and Sustainability.
Transportation accounted for 8.4% of the US gross domestic product in 2021, up from 7.7% in 2020, but down from 9.1% percent in 2019. During 2021, the wholesale and retail trade sector continued to require more transportation services than any other sector to produce one dollar of gross output.

Click for more Information.
The monthly volume of freight transportation services, measured by the freight Transportation Services Index, has grown since the 2020 economic recession, but as of September 2022 remains below the pre-pandemic August 2019 high. Transportation and transportation-related industries employed 14.9 million people (10.2% of the US labor force) in 2021—up 3.9% from 2020, surpassing the 2019 level of 14.8 million workers. However the impact is far greater because it is at the root of many businesses outside of the sector.
“Historically, transportation trends generally change unassumingly from year to year. However, the COVID-19 pandemic, first recognized as a national emergency in March 2020, produced unprecedented changes in transportation supply, demand, and performance in a matter of months,” BTS said. “At the same time, ongoing technological change, shifting national priorities, and cultural, demographic, and economic challenges have altered expectations of what is important to report to transportation stakeholders.”
The COVID-19 pandemic radically changed the availability and therefore the use of the US transportation system. Schedules and ridership for commercial airlines, Amtrak, transit systems, ocean vessel services, and other forms of transportation shrank to record lows beginning in March 2020 as passenger volumes and freight movement declined, BTS observed. It was not until mid-2022 did traffic on most travel modes begin to return to pre-pandemic levels. (Autoinformed.com on: Biden Recovery: Transportation Jobs Equal Pre-Pandemic; US Airlines Add Jobs for 18th Consecutive Month of Growth)
“In 2020, the U.S. transportation system served 331 million US residents residing in 122 million households, including people who may not own a vehicle or rarely travel, and millions of foreign visitors (see Chapter 2 – Passenger Travel and Equity). Transportation is used to commute to work, obtain goods and services, visit with family and friends, and travel for leisure and work. It also drives the economy, connecting 8.0 million business establishments with customers, suppliers, and workers [CENSUS 2022],” BTS said.
From the 2008 Great Recession to the onset of the COVID-19 pandemic in early 2020, both under global warming non-believers predominant in Republican Administrations we note, the US transportation system grew noticeably. However, the needed supporting infrastructure remained largely built and, worse, stagnant lacking repairs and investment. Tax cuts for the wealthy increasing government deficits were also a factor.
“The transportation system needs resilience to withstand traditional disruptions, such as extreme weather delays at the Nation’s ports and airports, as well as new disruptions, such as cybersecurity threats,” said BTS. Extreme weather events are increasing because of Global Warming.
Energy used by cars, trucks, buses, planes, ships, trains, and pipelines accounted for 27.6% of total U.S. energy use in 2021, making transportation the second largest user of energy in the economy, behind only electricity generation (Figure 6-1). China and the Russian Federation are the only two countries that consumed more energy for transportation. Specifically, the U.S. transportation system used 26.9 quadrillion Btu of energy to generate five trillion passenger-miles of travel and five trillion ton-miles of freight. From a global perspective, the U.S. accounts for about 17% of world energy use and 15% of global greenhouse gas (GHG) emissions.
“Automated vehicle development is advancing across all transportation modes. There are 39 state-level jurisdictions actively engaged in permitting testing or full deployment of driverless highway vehicles in 2022, more widespread autonomous port systems and ships, and the use of Positive Train Control in railroads,” BTS said.
*TSAR is a report of the BTS Director to the President and Congress. TSAR 2022 also includes an assessment of the state of transportation statistics, as well as efforts to improve how they are collected, compiled, analyzed, and published. The complete report can be downloaded from the BTS website https://www.bts.gov/tsar.

About Ken Zino
Ken Zino, editor and publisher of AutoInformed, is a versatile auto industry participant with global experience spanning decades in print and broadcast journalism, as well as social media. He has automobile testing, marketing, public relations and communications experience. He is past president of The International Motor Press Assn, the Detroit Press Club, founding member and first President of the Automotive Press Assn. He is a member of APA, IMPA and the Midwest Automotive Press Assn.
He also brings an historical perspective while citing their contemporary relevance of the work of legendary auto writers such as Ken Purdy, Jim Dunne or Jerry Flint, or writers such as Red Smith, Mark Twain, Thomas Jefferson – all to bring perspective to a chaotic automotive universe.
Above all, decades after he first drove a car, Zino still revels in the sound of the exhaust as the throttle is blipped during a downshift and the driver’s rush that occurs when the entry, apex and exit points of a turn are smoothly and swiftly crossed. It’s the beginning of a perfect lap.
AutoInformed has an editorial philosophy that loves transportation machines of all kinds while promoting critical thinking about the future use of cars and trucks.
Zino builds AutoInformed from his background in automotive journalism starting at Hearst Publishing in New York City on Motor and MotorTech Magazines and car testing where he reviewed hundreds of vehicles in his decade-long stint as the Detroit Bureau Chief of Road & Track magazine. Zino has also worked in Europe, and Asia – now the largest automotive market in the world with China at its center.


US Recovering from Covid. Greenhouse Gasses a Problem
Click for more information.
The Bureau of Transportation Statistics (BTS) released today the 28th edition of the Transportation Statistical Annual Report or TSAR.* Covered in the TSAR by legislative mandate are the State of the System; Passenger Travel and Equity; Freight and Supply Chain; Transportation Economics; Transportation Safety; Energy and Sustainability.
Transportation accounted for 8.4% of the US gross domestic product in 2021, up from 7.7% in 2020, but down from 9.1% percent in 2019. During 2021, the wholesale and retail trade sector continued to require more transportation services than any other sector to produce one dollar of gross output.
Click for more Information.
The monthly volume of freight transportation services, measured by the freight Transportation Services Index, has grown since the 2020 economic recession, but as of September 2022 remains below the pre-pandemic August 2019 high. Transportation and transportation-related industries employed 14.9 million people (10.2% of the US labor force) in 2021—up 3.9% from 2020, surpassing the 2019 level of 14.8 million workers. However the impact is far greater because it is at the root of many businesses outside of the sector.
“Historically, transportation trends generally change unassumingly from year to year. However, the COVID-19 pandemic, first recognized as a national emergency in March 2020, produced unprecedented changes in transportation supply, demand, and performance in a matter of months,” BTS said. “At the same time, ongoing technological change, shifting national priorities, and cultural, demographic, and economic challenges have altered expectations of what is important to report to transportation stakeholders.”
The COVID-19 pandemic radically changed the availability and therefore the use of the US transportation system. Schedules and ridership for commercial airlines, Amtrak, transit systems, ocean vessel services, and other forms of transportation shrank to record lows beginning in March 2020 as passenger volumes and freight movement declined, BTS observed. It was not until mid-2022 did traffic on most travel modes begin to return to pre-pandemic levels. (Autoinformed.com on: Biden Recovery: Transportation Jobs Equal Pre-Pandemic; US Airlines Add Jobs for 18th Consecutive Month of Growth)
“In 2020, the U.S. transportation system served 331 million US residents residing in 122 million households, including people who may not own a vehicle or rarely travel, and millions of foreign visitors (see Chapter 2 – Passenger Travel and Equity). Transportation is used to commute to work, obtain goods and services, visit with family and friends, and travel for leisure and work. It also drives the economy, connecting 8.0 million business establishments with customers, suppliers, and workers [CENSUS 2022],” BTS said.
From the 2008 Great Recession to the onset of the COVID-19 pandemic in early 2020, both under global warming non-believers predominant in Republican Administrations we note, the US transportation system grew noticeably. However, the needed supporting infrastructure remained largely built and, worse, stagnant lacking repairs and investment. Tax cuts for the wealthy increasing government deficits were also a factor.
“The transportation system needs resilience to withstand traditional disruptions, such as extreme weather delays at the Nation’s ports and airports, as well as new disruptions, such as cybersecurity threats,” said BTS. Extreme weather events are increasing because of Global Warming.
Energy used by cars, trucks, buses, planes, ships, trains, and pipelines accounted for 27.6% of total U.S. energy use in 2021, making transportation the second largest user of energy in the economy, behind only electricity generation (Figure 6-1). China and the Russian Federation are the only two countries that consumed more energy for transportation. Specifically, the U.S. transportation system used 26.9 quadrillion Btu of energy to generate five trillion passenger-miles of travel and five trillion ton-miles of freight. From a global perspective, the U.S. accounts for about 17% of world energy use and 15% of global greenhouse gas (GHG) emissions.
“Automated vehicle development is advancing across all transportation modes. There are 39 state-level jurisdictions actively engaged in permitting testing or full deployment of driverless highway vehicles in 2022, more widespread autonomous port systems and ships, and the use of Positive Train Control in railroads,” BTS said.
*TSAR is a report of the BTS Director to the President and Congress. TSAR 2022 also includes an assessment of the state of transportation statistics, as well as efforts to improve how they are collected, compiled, analyzed, and published. The complete report can be downloaded from the BTS website https://www.bts.gov/tsar.
About Ken Zino
Ken Zino, editor and publisher of AutoInformed, is a versatile auto industry participant with global experience spanning decades in print and broadcast journalism, as well as social media. He has automobile testing, marketing, public relations and communications experience. He is past president of The International Motor Press Assn, the Detroit Press Club, founding member and first President of the Automotive Press Assn. He is a member of APA, IMPA and the Midwest Automotive Press Assn. He also brings an historical perspective while citing their contemporary relevance of the work of legendary auto writers such as Ken Purdy, Jim Dunne or Jerry Flint, or writers such as Red Smith, Mark Twain, Thomas Jefferson – all to bring perspective to a chaotic automotive universe. Above all, decades after he first drove a car, Zino still revels in the sound of the exhaust as the throttle is blipped during a downshift and the driver’s rush that occurs when the entry, apex and exit points of a turn are smoothly and swiftly crossed. It’s the beginning of a perfect lap. AutoInformed has an editorial philosophy that loves transportation machines of all kinds while promoting critical thinking about the future use of cars and trucks. Zino builds AutoInformed from his background in automotive journalism starting at Hearst Publishing in New York City on Motor and MotorTech Magazines and car testing where he reviewed hundreds of vehicles in his decade-long stint as the Detroit Bureau Chief of Road & Track magazine. Zino has also worked in Europe, and Asia – now the largest automotive market in the world with China at its center.