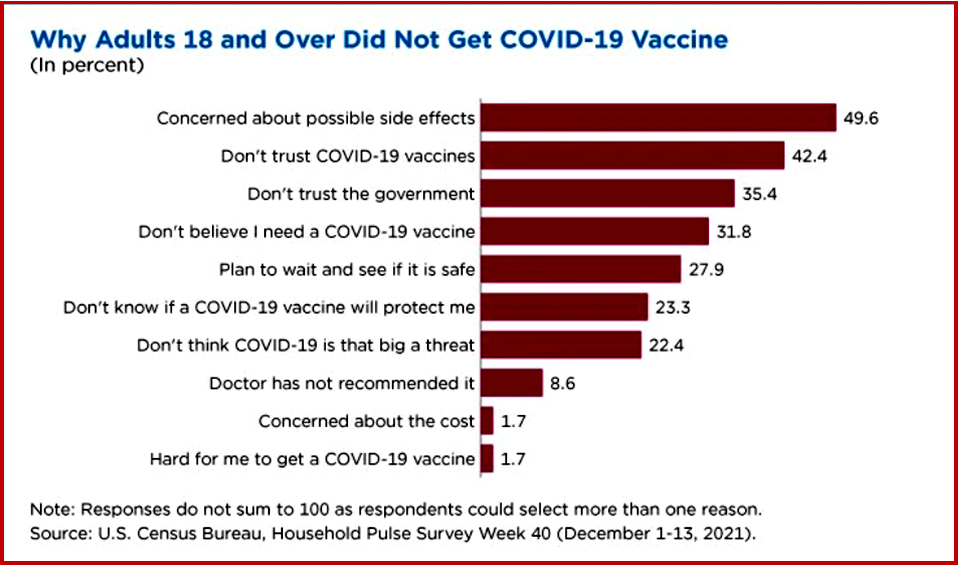
 According to the U.S. Census Bureau’s Household Pulse Survey (HPS), those who were unvaccinated1 against COVID in early December 2021, reported an assortment of reasons why:
- About half reported that they were concerned about possible vaccine side effects. vaccine.
- About 42% reported they “don’t trust the COVID-19 vaccine.”
- Less than 10% reported they hadn’t gotten the vaccine because their doctor had not recommended it.
- About 2% reported not getting the vaccine because of difficulty obtaining it.
Adults who had not received any doses of the COVID vaccine differed from those who had received at least one dose of a COVID vaccine across several channels:
- They were younger, on average, than those who had been vaccinated. Roughly 75% of the un-vaccinated were under age 50. Among the vaccinated, less than half were under age 50.
- They had lower levels of education, on average, than those who were vaccinated. Survey respondents who had received at least one dose were twice as likely as the un-vaccinated to have a college degree or higher.
- They were much less likely than vaccinated adults to be married (46% vs 56%).
- The share of un-vaccinated non-Hispanic White adults was similar to the share who were vaccinated. The same was true for Hispanic adults.
- But non-Hispanic Black adults were slightly more represented among the un-vaccinated (13%) than the vaccinated (11%), a small but statistically significant difference.
- There were notable differences for the Asian population, however: 6% of the vaccinated were non-Hispanic Asian but only 1% of the un-vaccinated were non-Hispanic Asian.
Most of the Household Pulse Survey response options are either about information (“Don’t know if it will protect me”) or trust (“Don’t trust the vaccine”). However, one involves access: “It’s hard for me to get a COVID-19 vaccine.”
Who are the people in the small subset of adults who responded to the HPS who reported that they had not gotten a vaccine because it was hard to get? Compared to all HPS respondents, the hard-to-reach:
- Were more likely to be non-White.
- Were less likely to be married (35% of the hard to reach were married compared to 54% of all respondents).
- Had lower levels of education, on average, and were more economically disadvantaged; about half of this hard-to-reach population reported difficulty meeting expenses in the week prior to the survey.
- Were much more likely to report a disability. The HPS asks about difficulty seeing, hearing, remembering or walking or climbing stairs. Those who reported being unvaccinated because they had no access to the vaccine were almost twice as likely to report either complete impairment or “a lot of difficulty” with one or more of these measures than the general population.
1 Vaccinated refers to adults who have received at least one dose of any COVID vaccine, and “unvaccinated” refers to adults who have not received any. Unvaccinated adults who responded to the survey could select more than one reason. The findings are based on the first data from Phase 3.3 of the HPS. These data were collected Dec. 1-Dec. 13 and released last week.
HPS Phase 3.3 is the latest update to the Census Bureau’s experimental data collection effort to measure the impact of the COVID-19 pandemic on U.S. households. The new version of the questionnaire is set to continue into February 2022. For adults 18 and over, a previous question about plans for receiving all required COVID-19 vaccinations was replaced with one focused on the specific number of vaccinations received. There is also a new question about vaccine brands.
About the Data
Approximately 1,044,000 housing units were selected from the sampling frame for this HPS collection period, and approximately 61,000 respondents answered the online questionnaire. Their responses were the basis of this analysis.
The Household Pulse Survey was launched in April 2020, to gauge the impact of the coronavirus pandemic quickly and efficiently on households. Over the course of 40 collection cycles, HPS data have been disseminated in near-real time to inform federal and state response and recovery planning. The data collected have enabled the Census Bureau to produce statistics at the national and state level and for the 15 largest Metropolitan Statistical Areas. More information is available on these HPS pages: Household Pulse Survey tables, Technical Documentation and Public Use File (PUF) microdata.

About Ken Zino
Ken Zino, editor and publisher of AutoInformed, is a versatile auto industry participant with global experience spanning decades in print and broadcast journalism, as well as social media. He has automobile testing, marketing, public relations and communications experience. He is past president of The International Motor Press Assn, the Detroit Press Club, founding member and first President of the Automotive Press Assn. He is a member of APA, IMPA and the Midwest Automotive Press Assn.
He also brings an historical perspective while citing their contemporary relevance of the work of legendary auto writers such as Ken Purdy, Jim Dunne or Jerry Flint, or writers such as Red Smith, Mark Twain, Thomas Jefferson – all to bring perspective to a chaotic automotive universe.
Above all, decades after he first drove a car, Zino still revels in the sound of the exhaust as the throttle is blipped during a downshift and the driver’s rush that occurs when the entry, apex and exit points of a turn are smoothly and swiftly crossed. It’s the beginning of a perfect lap.
AutoInformed has an editorial philosophy that loves transportation machines of all kinds while promoting critical thinking about the future use of cars and trucks.
Zino builds AutoInformed from his background in automotive journalism starting at Hearst Publishing in New York City on Motor and MotorTech Magazines and car testing where he reviewed hundreds of vehicles in his decade-long stint as the Detroit Bureau Chief of Road & Track magazine. Zino has also worked in Europe, and Asia – now the largest automotive market in the world with China at its center.


Census – Who Aren’t Vaccinated Against COVID?
Adults who had not received any doses of the COVID vaccine differed from those who had received at least one dose of a COVID vaccine across several channels:
Most of the Household Pulse Survey response options are either about information (“Don’t know if it will protect me”) or trust (“Don’t trust the vaccine”). However, one involves access: “It’s hard for me to get a COVID-19 vaccine.”
Who are the people in the small subset of adults who responded to the HPS who reported that they had not gotten a vaccine because it was hard to get? Compared to all HPS respondents, the hard-to-reach:
1 Vaccinated refers to adults who have received at least one dose of any COVID vaccine, and “unvaccinated” refers to adults who have not received any. Unvaccinated adults who responded to the survey could select more than one reason. The findings are based on the first data from Phase 3.3 of the HPS. These data were collected Dec. 1-Dec. 13 and released last week.
HPS Phase 3.3 is the latest update to the Census Bureau’s experimental data collection effort to measure the impact of the COVID-19 pandemic on U.S. households. The new version of the questionnaire is set to continue into February 2022. For adults 18 and over, a previous question about plans for receiving all required COVID-19 vaccinations was replaced with one focused on the specific number of vaccinations received. There is also a new question about vaccine brands.
About the Data
Approximately 1,044,000 housing units were selected from the sampling frame for this HPS collection period, and approximately 61,000 respondents answered the online questionnaire. Their responses were the basis of this analysis.
The Household Pulse Survey was launched in April 2020, to gauge the impact of the coronavirus pandemic quickly and efficiently on households. Over the course of 40 collection cycles, HPS data have been disseminated in near-real time to inform federal and state response and recovery planning. The data collected have enabled the Census Bureau to produce statistics at the national and state level and for the 15 largest Metropolitan Statistical Areas. More information is available on these HPS pages: Household Pulse Survey tables, Technical Documentation and Public Use File (PUF) microdata.
About Ken Zino
Ken Zino, editor and publisher of AutoInformed, is a versatile auto industry participant with global experience spanning decades in print and broadcast journalism, as well as social media. He has automobile testing, marketing, public relations and communications experience. He is past president of The International Motor Press Assn, the Detroit Press Club, founding member and first President of the Automotive Press Assn. He is a member of APA, IMPA and the Midwest Automotive Press Assn. He also brings an historical perspective while citing their contemporary relevance of the work of legendary auto writers such as Ken Purdy, Jim Dunne or Jerry Flint, or writers such as Red Smith, Mark Twain, Thomas Jefferson – all to bring perspective to a chaotic automotive universe. Above all, decades after he first drove a car, Zino still revels in the sound of the exhaust as the throttle is blipped during a downshift and the driver’s rush that occurs when the entry, apex and exit points of a turn are smoothly and swiftly crossed. It’s the beginning of a perfect lap. AutoInformed has an editorial philosophy that loves transportation machines of all kinds while promoting critical thinking about the future use of cars and trucks. Zino builds AutoInformed from his background in automotive journalism starting at Hearst Publishing in New York City on Motor and MotorTech Magazines and car testing where he reviewed hundreds of vehicles in his decade-long stint as the Detroit Bureau Chief of Road & Track magazine. Zino has also worked in Europe, and Asia – now the largest automotive market in the world with China at its center.