Deficits keep growing under President Trump’s economic policies.
During the past decade, the federal government’s debt increased at a faster rate than at any time since the end of World War II, according to the Congressional Budget office in January. Without question our debt has outrun the economic growth over that period. At the end of 2019, federal debt was higher than at any other time since just after the war – exacerbated by Republican tax cuts for corporations and the wealthy.
Debt held by the public is a measure that indicates the extent to which federal borrowing affects the availability of private funds for other borrowers. All else being equal, an increase in government borrowing reduces the amount of money available to other borrowers, putting upward pressure on interest rates and reducing private investment. It is the measure of debt most often used by CBO in its reports on the budget. The cost of growing debt increases the finance payments of new and used vehicles.
Trillion Dollar Deficits are the New Normal
- Debt held by the public, or the extent to which federal borrowing affects the availability of private funds for other borrowers, is the measure of debt CBO uses most often in its reports on the budget.
- At $16.8 trillion, debt held by the public at the end of 2019 was equal to 79% of gross domestic product (GDP), far greater than the average debt for the past 50 years. CBO projects that if current laws generally remained unchanged, that debt would increase to $31.4 trillion, or 98% of GDP, by 2030. “Such high and rising debt could significantly affect the U.S. economy and the federal budget,” CBO warns as the COVID-19 crisis grows with further non-projected costs from a possible US and worldwide recession or depression.
- At the end of 2019, the 10 countries with the largest holdings were Japan, China, the United Kingdom, Brazil, Ireland, Luxembourg, Switzerland, the Cayman Islands, Hong Kong, and Belgium. (These are often tax shelters, not the residence of the holder – editor.)
Debt Held by the Public
To finance the government’s activities, the Treasury issues securities, collectively labeled debt held by the public:
- They differ in time to maturity, the ways they are sold to investors, and the structure of their interest payments.
- Marketable securities make up the lion’s share of that debt,
- and non-tradable securities, such as savings bonds, make up the rest.
The Treasury sells securities in the capital markets—often through a primary dealer intermediary—to U.S. buyers (such as the Federal Reserve System, mutual funds, financial institutions, and individual people), to private investors overseas, and to the central banks of other countries (i.e. China). Domestic investors currently own about three-fifths of outstanding debt held by the public.
Other Ways to Measure Debt
Several other measures provide information about our debt, although each has limitations. In addition to discussing debt held by the public, CBO looks at:
- debt held by the public net of financial assets,
- gross debt,
- and debt subject to limit by statute.
Debt Held by the Public Net of Financial Assets
Government spending includes not only payments for services or physical assets, such as real estate or military resources, but also spending that results in the acquisition of financial assets. When the government issues debt to acquire those assets – say to finance student loans – its overall financial condition remains roughly unchanged, as does the amount of debt held by the public net of financial assets, according to CBO.
- If those assets are retained, they generate dividends, payments of interest, and repayments of principal that will reduce the government’s need to borrow.
- If financial assets are sold by the government, the proceeds can be used to pay down a portion of the federal debt. Although calculating the value of those assets is subject to interpretation, debt held by the public net of financial assets reflects the government’s overall financial condition more comprehensively than other measures can, according to CBO.
- Less than 1% of debt held by the public is issued by other agencies, such as the Tennessee Valley Authority. Debt issued by Fannie Mae and Freddie Mac – the two government-sponsored housing enterprises under federal conservatorship – is not included in debt held by the public
Gross Debt
Another measure of the government’s overall financial position is gross debt, which consists of debt held by the public along with Treasury securities held by federal trust funds and other government accounts. The value of intra-governmental Treasury securities – the debt owed by the Treasury to such funds – indicates the amount by which cumulative revenues (an example is payroll tax collections for the Social Security and Medicare trust funds) have exceeded payments from those trust funds or accounts, plus interest attributed to the surpluses. The value of intra-governmental Treasury Securities is not, however, a meaningful measure of the government’s long-term obligations for those programs CBO warns.
Debt Subject to Limit
The rough equivalent of gross debt, debt subject to limit is usually constrained by amounts specified in law: It is the maximum amount of debt that the Treasury can issue to the public or to other federal agencies. The main difference between debt subject to limit and gross debt is that the statutory limit excludes most debt issued by the Federal Financing Bank—an arm of the Treasury that can issue up to $15 billion in its own debt. Debt subject to limit also accounts for other adjustments that are excluded from calculations of gross debt says CBO.
CBO Projections for Federal Debt Over the Next Decade
In CBO’s baseline, which incorporates the risky assumption that current laws governing taxes and spending generally remain unchanged, debt is projected to grow at a substantially faster rate than the U.S. economy. In baseline projections that CBO published in January 2020, debt held by the public reaches $31.4 trillion (that is 98% of GDP before a COVID-19 depression, if it thrives) by 2030.
That debt would be the largest since 1946 and more than twice the average over the past 50 years.
In CBO’s estimation, debt as measured other ways also would grow faster than the economy, although the growth in gross debt would be slowest because spending from the Social Security and Medicare trust funds is projected to exceed receipts to those funds. As a result, those funds are projected to redeem more in Treasury securities than they purchase, thereby reducing gross debt.
“The projected growth in debt would hurt and slow economic output over time and pose other significant risks to the nation’s fiscal and economic outlook,” says CBO.
Moreover, CBO observes without political spin, “the resulting higher interest costs would increase payments to foreign debt holders and thus reduce the income of U.S. households by rising amounts.”
US Trade January 2020. Data are goods only on a Census Basis, in Billions of Dollars.

About Ken Zino
Ken Zino, editor and publisher of AutoInformed, is a versatile auto industry participant with global experience spanning decades in print and broadcast journalism, as well as social media. He has automobile testing, marketing, public relations and communications experience. He is past president of The International Motor Press Assn, the Detroit Press Club, founding member and first President of the Automotive Press Assn. He is a member of APA, IMPA and the Midwest Automotive Press Assn.
He also brings an historical perspective while citing their contemporary relevance of the work of legendary auto writers such as Ken Purdy, Jim Dunne or Jerry Flint, or writers such as Red Smith, Mark Twain, Thomas Jefferson – all to bring perspective to a chaotic automotive universe.
Above all, decades after he first drove a car, Zino still revels in the sound of the exhaust as the throttle is blipped during a downshift and the driver’s rush that occurs when the entry, apex and exit points of a turn are smoothly and swiftly crossed. It’s the beginning of a perfect lap.
AutoInformed has an editorial philosophy that loves transportation machines of all kinds while promoting critical thinking about the future use of cars and trucks.
Zino builds AutoInformed from his background in automotive journalism starting at Hearst Publishing in New York City on Motor and MotorTech Magazines and car testing where he reviewed hundreds of vehicles in his decade-long stint as the Detroit Bureau Chief of Road & Track magazine. Zino has also worked in Europe, and Asia – now the largest automotive market in the world with China at its center.


National Debt Projections – Off the Chart Before COVID-19
Deficits keep growing under President Trump’s economic policies.
During the past decade, the federal government’s debt increased at a faster rate than at any time since the end of World War II, according to the Congressional Budget office in January. Without question our debt has outrun the economic growth over that period. At the end of 2019, federal debt was higher than at any other time since just after the war – exacerbated by Republican tax cuts for corporations and the wealthy.
Debt held by the public is a measure that indicates the extent to which federal borrowing affects the availability of private funds for other borrowers. All else being equal, an increase in government borrowing reduces the amount of money available to other borrowers, putting upward pressure on interest rates and reducing private investment. It is the measure of debt most often used by CBO in its reports on the budget. The cost of growing debt increases the finance payments of new and used vehicles.
Trillion Dollar Deficits are the New Normal
Debt Held by the Public
To finance the government’s activities, the Treasury issues securities, collectively labeled debt held by the public:
The Treasury sells securities in the capital markets—often through a primary dealer intermediary—to U.S. buyers (such as the Federal Reserve System, mutual funds, financial institutions, and individual people), to private investors overseas, and to the central banks of other countries (i.e. China). Domestic investors currently own about three-fifths of outstanding debt held by the public.
Other Ways to Measure Debt
Several other measures provide information about our debt, although each has limitations. In addition to discussing debt held by the public, CBO looks at:
Debt Held by the Public Net of Financial Assets
Government spending includes not only payments for services or physical assets, such as real estate or military resources, but also spending that results in the acquisition of financial assets. When the government issues debt to acquire those assets – say to finance student loans – its overall financial condition remains roughly unchanged, as does the amount of debt held by the public net of financial assets, according to CBO.
Gross Debt
Another measure of the government’s overall financial position is gross debt, which consists of debt held by the public along with Treasury securities held by federal trust funds and other government accounts. The value of intra-governmental Treasury securities – the debt owed by the Treasury to such funds – indicates the amount by which cumulative revenues (an example is payroll tax collections for the Social Security and Medicare trust funds) have exceeded payments from those trust funds or accounts, plus interest attributed to the surpluses. The value of intra-governmental Treasury Securities is not, however, a meaningful measure of the government’s long-term obligations for those programs CBO warns.
Debt Subject to Limit
The rough equivalent of gross debt, debt subject to limit is usually constrained by amounts specified in law: It is the maximum amount of debt that the Treasury can issue to the public or to other federal agencies. The main difference between debt subject to limit and gross debt is that the statutory limit excludes most debt issued by the Federal Financing Bank—an arm of the Treasury that can issue up to $15 billion in its own debt. Debt subject to limit also accounts for other adjustments that are excluded from calculations of gross debt says CBO.
CBO Projections for Federal Debt Over the Next Decade
In CBO’s baseline, which incorporates the risky assumption that current laws governing taxes and spending generally remain unchanged, debt is projected to grow at a substantially faster rate than the U.S. economy. In baseline projections that CBO published in January 2020, debt held by the public reaches $31.4 trillion (that is 98% of GDP before a COVID-19 depression, if it thrives) by 2030.
That debt would be the largest since 1946 and more than twice the average over the past 50 years.
In CBO’s estimation, debt as measured other ways also would grow faster than the economy, although the growth in gross debt would be slowest because spending from the Social Security and Medicare trust funds is projected to exceed receipts to those funds. As a result, those funds are projected to redeem more in Treasury securities than they purchase, thereby reducing gross debt.
“The projected growth in debt would hurt and slow economic output over time and pose other significant risks to the nation’s fiscal and economic outlook,” says CBO.
Moreover, CBO observes without political spin, “the resulting higher interest costs would increase payments to foreign debt holders and thus reduce the income of U.S. households by rising amounts.”
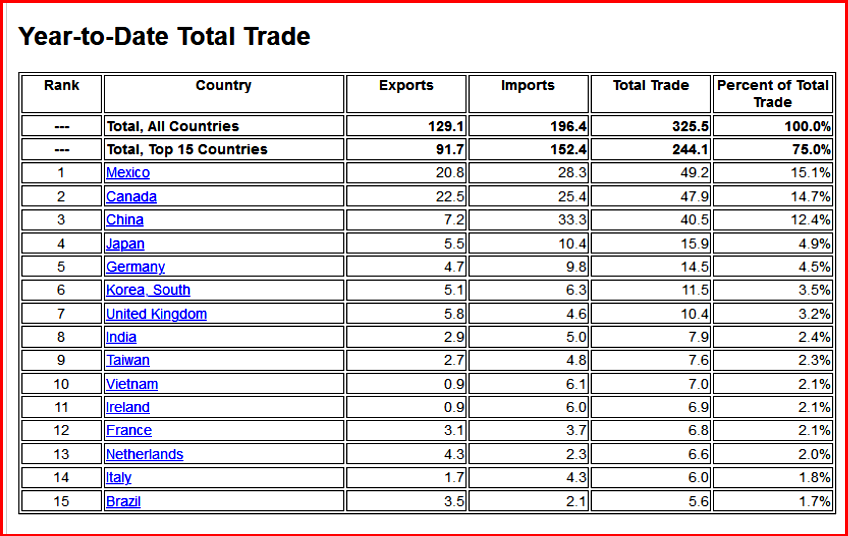
US Trade Deficit Continues at $45 Billion a Month
US Trade January 2020. Data are goods only on a Census Basis, in Billions of Dollars.
About Ken Zino
Ken Zino, editor and publisher of AutoInformed, is a versatile auto industry participant with global experience spanning decades in print and broadcast journalism, as well as social media. He has automobile testing, marketing, public relations and communications experience. He is past president of The International Motor Press Assn, the Detroit Press Club, founding member and first President of the Automotive Press Assn. He is a member of APA, IMPA and the Midwest Automotive Press Assn. He also brings an historical perspective while citing their contemporary relevance of the work of legendary auto writers such as Ken Purdy, Jim Dunne or Jerry Flint, or writers such as Red Smith, Mark Twain, Thomas Jefferson – all to bring perspective to a chaotic automotive universe. Above all, decades after he first drove a car, Zino still revels in the sound of the exhaust as the throttle is blipped during a downshift and the driver’s rush that occurs when the entry, apex and exit points of a turn are smoothly and swiftly crossed. It’s the beginning of a perfect lap. AutoInformed has an editorial philosophy that loves transportation machines of all kinds while promoting critical thinking about the future use of cars and trucks. Zino builds AutoInformed from his background in automotive journalism starting at Hearst Publishing in New York City on Motor and MotorTech Magazines and car testing where he reviewed hundreds of vehicles in his decade-long stint as the Detroit Bureau Chief of Road & Track magazine. Zino has also worked in Europe, and Asia – now the largest automotive market in the world with China at its center.