Click to enlarge.
The Bureau of Transportation Statistics (BTS) today released its monthly update to National Transportation Statistics (NTS), a guide to historical national-level transportation trends. Of interest to AutoInformed are trends in Gasoline Hybrid and Electric Vehicle Sales; the Average Age of Automobiles and Trucks in Operation; and U.S.-Canadian and U.S.-Mexican Border Land-Freight Gateway Travel and Goods Movement.
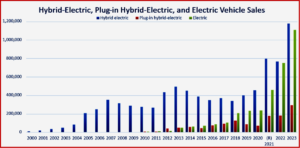
A trend of note is that during the last three years, sales of Hybrids, EVs and PHEVs have come close to doubling, representing ~2,500,000 in annual sales during 2024.

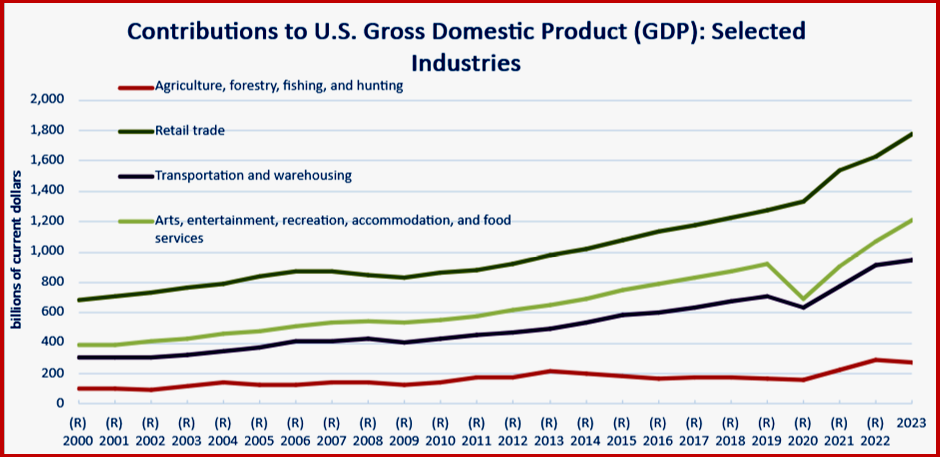
Not all industries were affected to the same degree by Covid.
Age of Vehicles Is Increasing
The average age of the Nation’s light vehicles (which includes passenger cars and light trucks) continues to increase steadily over time, up from 10.6 years in 2010 to 11.7 years in 2018. The pandemic-induced drop in vehicle sales increased the average vehicle age even further, reaching 12.5 years in 2023. Vehicle condition usually declines with use and age.
Some additional key data points from the 2021 vehicle in use (VIUS) datasets include the following:
- 41% of vehicles in use (VIUS) vehicles below 10,000 pounds were more than 10 years old and averaged 7100 miles per year, while newer light-duty vehicles averaged more than 10,000 miles per year.
- 47% of trucks heavier than 26,000 pounds were more than 10 years old and averaged 20,000 miles per year.
- 10% of trucks heavier than 26,000 pounds were from model years 2020 and 2021 and averaged more than 75,000 miles per year.
“Various factors have been offered to explain the increasing age of the vehicle fleet: longer vehicle life due to improvements in vehicle manufacturing, an increase in the number of vehicles per household (e.g., older vehicles passed on to children of driving age when parents get a new car), changes in driving habits, and deferring vehicle purchases during economic recessions. As to the latter, the average age increase in the light-duty vehicle fleet was 12% between 2008 and 2013, a period of economic recession and recovery, compared with average age increases during the non-recession periods immediately before and after the recession of about 4% between 2002 and 2007 and 3% between 2015 and 2019 [BTS 2024f]. In comparison, the vehicle fleet has aged 6.8% from 2018 to 2023, which spans the COVID-19 pandemic years,” BLS said.
Canada and Mexico
“In 2023, the United States’ northern and southern neighbors, Canada and Mexico, remained pivotal trade partners. The total freight exchanged between the United States and Canada reached $773 billion, marking a 3% decrease from 2022’s peak of $796.7 billion.
“Meanwhile, trade with Mexico rose by 2.8%, with freight flows totaling $798 billion in 2023. In stark contrast, trade with China saw a substantial decline, dropping by nearly16.8% from $690.4 billion in 2022 to $574.7 billion in 2023.
“Between 2021 and 2023, the U.S. trade landscape shifted significantly, particularly in its relationships with China and Mexico. U.S.-China trade saw a marked decrease over this period, with the total value falling from a 2022 peak of $690.3 billion to $574.7 billion in 2023,a 16.7% drop. This trend signals changing dynamics between the two largest economies. Canada and Mexico both surpassed China as the United States’ top trade partners during this period. Canada was the leading partner in 2021 and 2022,but Mexico overtook that position in 2023, with China remaining in third place throughout these years,” BTS said.

About Ken Zino
Ken Zino, editor and publisher of AutoInformed, is a versatile auto industry participant with global experience spanning decades in print and broadcast journalism, as well as social media. He has automobile testing, marketing, public relations and communications experience. He is past president of The International Motor Press Assn, the Detroit Press Club, founding member and first President of the Automotive Press Assn. He is a member of APA, IMPA and the Midwest Automotive Press Assn.
He also brings an historical perspective while citing their contemporary relevance of the work of legendary auto writers such as Ken Purdy, Jim Dunne or Jerry Flint, or writers such as Red Smith, Mark Twain, Thomas Jefferson – all to bring perspective to a chaotic automotive universe.
Above all, decades after he first drove a car, Zino still revels in the sound of the exhaust as the throttle is blipped during a downshift and the driver’s rush that occurs when the entry, apex and exit points of a turn are smoothly and swiftly crossed. It’s the beginning of a perfect lap.
AutoInformed has an editorial philosophy that loves transportation machines of all kinds while promoting critical thinking about the future use of cars and trucks.
Zino builds AutoInformed from his background in automotive journalism starting at Hearst Publishing in New York City on Motor and MotorTech Magazines and car testing where he reviewed hundreds of vehicles in his decade-long stint as the Detroit Bureau Chief of Road & Track magazine. Zino has also worked in Europe, and Asia – now the largest automotive market in the world with China at its center.


US Electrified Vehicle Sales Soar in 2024
Click to enlarge.
The Bureau of Transportation Statistics (BTS) today released its monthly update to National Transportation Statistics (NTS), a guide to historical national-level transportation trends. Of interest to AutoInformed are trends in Gasoline Hybrid and Electric Vehicle Sales; the Average Age of Automobiles and Trucks in Operation; and U.S.-Canadian and U.S.-Mexican Border Land-Freight Gateway Travel and Goods Movement.
A trend of note is that during the last three years, sales of Hybrids, EVs and PHEVs have come close to doubling, representing ~2,500,000 in annual sales during 2024.
Not all industries were affected to the same degree by Covid.
Age of Vehicles Is Increasing
The average age of the Nation’s light vehicles (which includes passenger cars and light trucks) continues to increase steadily over time, up from 10.6 years in 2010 to 11.7 years in 2018. The pandemic-induced drop in vehicle sales increased the average vehicle age even further, reaching 12.5 years in 2023. Vehicle condition usually declines with use and age.
Some additional key data points from the 2021 vehicle in use (VIUS) datasets include the following:
“Various factors have been offered to explain the increasing age of the vehicle fleet: longer vehicle life due to improvements in vehicle manufacturing, an increase in the number of vehicles per household (e.g., older vehicles passed on to children of driving age when parents get a new car), changes in driving habits, and deferring vehicle purchases during economic recessions. As to the latter, the average age increase in the light-duty vehicle fleet was 12% between 2008 and 2013, a period of economic recession and recovery, compared with average age increases during the non-recession periods immediately before and after the recession of about 4% between 2002 and 2007 and 3% between 2015 and 2019 [BTS 2024f]. In comparison, the vehicle fleet has aged 6.8% from 2018 to 2023, which spans the COVID-19 pandemic years,” BLS said.
Canada and Mexico
“In 2023, the United States’ northern and southern neighbors, Canada and Mexico, remained pivotal trade partners. The total freight exchanged between the United States and Canada reached $773 billion, marking a 3% decrease from 2022’s peak of $796.7 billion.
“Meanwhile, trade with Mexico rose by 2.8%, with freight flows totaling $798 billion in 2023. In stark contrast, trade with China saw a substantial decline, dropping by nearly16.8% from $690.4 billion in 2022 to $574.7 billion in 2023.
“Between 2021 and 2023, the U.S. trade landscape shifted significantly, particularly in its relationships with China and Mexico. U.S.-China trade saw a marked decrease over this period, with the total value falling from a 2022 peak of $690.3 billion to $574.7 billion in 2023,a 16.7% drop. This trend signals changing dynamics between the two largest economies. Canada and Mexico both surpassed China as the United States’ top trade partners during this period. Canada was the leading partner in 2021 and 2022,but Mexico overtook that position in 2023, with China remaining in third place throughout these years,” BTS said.
About Ken Zino
Ken Zino, editor and publisher of AutoInformed, is a versatile auto industry participant with global experience spanning decades in print and broadcast journalism, as well as social media. He has automobile testing, marketing, public relations and communications experience. He is past president of The International Motor Press Assn, the Detroit Press Club, founding member and first President of the Automotive Press Assn. He is a member of APA, IMPA and the Midwest Automotive Press Assn. He also brings an historical perspective while citing their contemporary relevance of the work of legendary auto writers such as Ken Purdy, Jim Dunne or Jerry Flint, or writers such as Red Smith, Mark Twain, Thomas Jefferson – all to bring perspective to a chaotic automotive universe. Above all, decades after he first drove a car, Zino still revels in the sound of the exhaust as the throttle is blipped during a downshift and the driver’s rush that occurs when the entry, apex and exit points of a turn are smoothly and swiftly crossed. It’s the beginning of a perfect lap. AutoInformed has an editorial philosophy that loves transportation machines of all kinds while promoting critical thinking about the future use of cars and trucks. Zino builds AutoInformed from his background in automotive journalism starting at Hearst Publishing in New York City on Motor and MotorTech Magazines and car testing where he reviewed hundreds of vehicles in his decade-long stint as the Detroit Bureau Chief of Road & Track magazine. Zino has also worked in Europe, and Asia – now the largest automotive market in the world with China at its center.