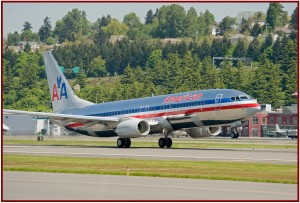
The U.S. Department of Transportation’s Bureau of Transportation Statistics (BTS) today reported that 803.5 million scheduled passengers traveled on U.S. airlines and on foreign airlines serving the United States in 2011. This is a slight 1.7% increase from 2010. The 2011 passenger total was 4.3% higher than in 2009.
U.S. airlines carried 1.3% more domestic passengers in 2011 and 1.7% more international passengers than in 2010 for the system wide increase of 1.3%. Passengers to and from the United States on foreign carriers increased 5.6% from 2010.
Delta Air Lines, because of its merger with Northwest Airlines, carried more total system passengers in 2011 than any other U.S. airline for the second consecutive year. American Airlines carried more international passengers to and from the United States in 2011 than any other U.S. or foreign carrier, followed closely by Delta.
The number of passengers increased in every month of 2011 from 2010 except in October when a 1.3% decrease in domestic passengers resulted in a system wide 0.7% decrease that was not fully offset by an increase in international passengers. Higher fuel prices led to airlines cutting back to fall/winter schedules earlier than usual. As a result, there were not as many domestic seats available in October as expected.
More total system passengers boarded planes in 2011 at Atlanta Hartsfield-Jackson International than at any other U.S. airport. More international passengers boarded planes at New York John F. Kennedy than at any other U.S. airport.
| Scheduled Domestic and International Airline Travel on U.S. and Foreign Airlines | |||
|
Annual |
|||
| 2010 | 2011 | ∆ % | |
| Passengers (millions) | 790.1 | 803.5 | 1.7 |
| Flights (thousands) | 10,021.6 | 9,984.4 | -0.4 |
| Revenue Passenger Miles (billions) | 1,071.2 | 1,105.5 | 3.2 |
| Available Seat-Miles (billions) | 1,308.1 | 1,355.6 | 3.6 |
| Load Factor** | 81.9 | 81.6 | -0.3 |
| Flight Stage Length*** | 825.4 | 847.5 | 2.7 |
| Passenger Trip Length**** | 1,355.7 | 1,375.8 | 1.5 |
| Source: Bureau of Transportation Statistics* Includes U.S. carrier scheduled domestic and international service and foreign carrier scheduled international service to and from the United States. | |||
| ** Change in load factor points | |||
| *** The average non-stop distance flown per departure in miles | |||
| **** The average distance flown per passenger in miles | |||


