Click for more data and to enlarge.
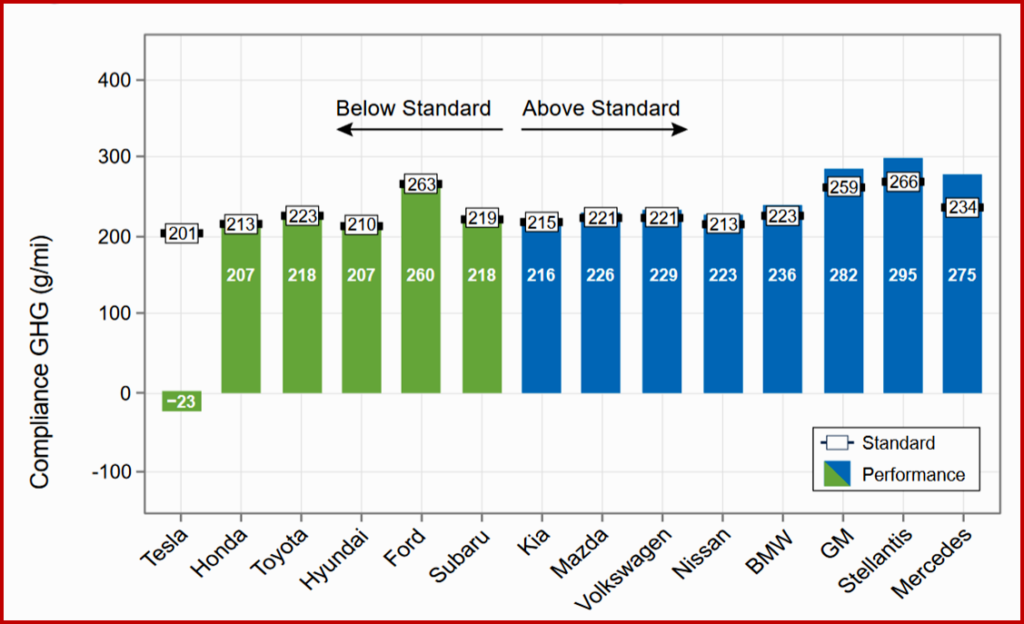
The US. Environmental Protection Agency just before this Christmas past released its annual Automotive Trends Report.* It said that model year 2022 vehicle fuel economy reached a record high, while emission levels dropped to record low levels. The report also shows that through the MY 2022 reporting period, all 14 large manufacturers are in compliance with the light-duty greenhouse gas program requirements. This welcome news is rooted in the awakened environmental policies of the Obama and Biden Administrations.**
“As the United States accelerates towards a clean transportation future, today’s report highlights the historic progress made so far by the industry to reduce climate pollution and other harmful emissions,” said EPA Administrator Michael S. Regan. “We are thrilled to see manufacturers continue to innovate and develop technologies in multiple vehicle categories that have led to a substantial increase in miles per gallon, passing cost savings onto families across the nation.”
Following are Key Points of the EPA 2022 Report edited for Clarity
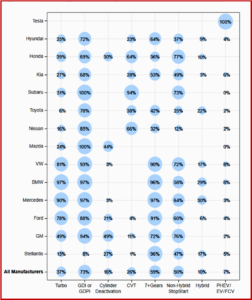
Manufacturers Continue to Use Various Advanced Technologies: “Innovation in the automobile industry has led to a wide array of technology available to manufacturers to achieve CO2 emissions, fuel economy, and performance goals. (Figure ES-5 illustrates manufacturer-specific technology usage for model year 2022, with larger circles representing higher usage rates.) The technologies in Figure ES-5 are all being used by manufacturers to, in part, reduce CO2 emissions and increase fuel economy. Each of the fourteen largest manufacturers have adopted several of these technologies into their vehicles, with many manufacturers achieving very high penetrations of several technologies. It is also clear that manufacturers’ strategies to develop and adopt new technologies are unique and vary significantly. Each manufacturer is choosing technologies that best meet the design requirements of their vehicles, and in many cases, that technology is changing quickly.

Click for more data and enlarge.
“Engine technologies such as turbocharged engines (Turbo) and gasoline direct injection (GDI) allow for more efficient engine design and operation. A growing number of engines can use GDI or port fuel injection (GDPI) depending on conditions – these engines are included with GDI engines in Figure ES-5 for the first time this year. Cylinder deactivation (CD) allows for use of only a portion of the engine when less power is needed, while stop/start systems can turn off the engine entirely at idle to save fuel. Hybrid vehicles use a larger battery to recapture braking energy and provide power when necessary, allowing for a smaller, more efficiently operated engine. The hybrid category includes “strong” hybrid systems that can temporarily power the vehicle without engaging the engine and smaller “mild” hybrid systems that cannot propel the vehicle on their own. Transmissions that have more gear ratios, or speeds, allow the engine to more frequently operate near peak efficiency. Two categories of advanced transmissions are shown in Figure ES-5: transmissions with seven or more discrete speeds (7+Gears), and continuously variable transmissions (CVTs).
“In model year 2022, hybrid vehicles reached a new high of 10% of all production. Strong and mild hybrid production grew, with mild hybrids accounting for 41% of overall hybrid production. The combined category of electric vehicles (EVs), plug-in hybrid vehicles (PHEVs), and fuel cell electric vehicles (FCVs) increased from 4% of production in model year 2021 to 7% of production in model year 2022 and are projected to reach 12% of production in model year 2023. This trend will likely continue as EV production is expected to grow across the industry in coming years.

Click for more data and to enlarge.
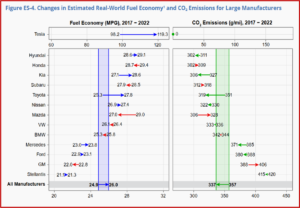
“In model year 2022, the average estimated real-world CO2 emission rate for all new vehicles fell by 10 g/mi to 337 g/mi, the lowest ever measured. Real-world fuel economy increased by 0.6 mpg to a record high 26.0 mpg. This is the largest single year improvement in CO2 emission rates and fuel economy in nine years. Since model year 2004, CO2 emissions have decreased 27%, or 123 g/mi, and fuel economy has increased 35%, or 6.7 mpg. Over that time, CO2 emissions have improved in fifteen of eighteen years. (The trends in CO2 emissions and fuel economy since 1975 are shown in Figure ES-1) Preliminary data suggest that CO2 emissions and fuel economy in model year 2023 will improve from 2022. (These data are shown in Figure ES-1 as a dot because the values are based on manufacturer projections rather than final data)
*Automotive Trends Report
Since 1975, EPA has collected data on every new light-duty vehicle model sold in the United States either from testing performed by EPA at the National Vehicle and Fuel Emissions Laboratory in Ann Arbor, Michigan, or directly from manufacturers using official EPA test procedures. These data are collected to support several national programs, including EPA criteria pollutant and GHG standards, the US Department of Transportation’s National Highway Traffic Safety Administration (NHTSA) Corporate Average Fuel Economy (CAFE) standards, and vehicle Fuel Economy and Environment labels. This expansive data set allows EPA to provide a comprehensive analysis of the automotive industry over the last 45+ years.
The carbon dioxide (CO2) emissions and fuel economy data in this report fall into one of two categories. The first is compliance data, which are measured using laboratory tests required by law for CAFE and adopted by EPA for GHG compliance. The second is estimated real-world data, which are measured using additional laboratory tests to capture a wider range of operating conditions (including hot and cold weather, higher speeds, and faster accelerations) encountered by an average driver. This report shows real-world data, except for discussions specific to GHG compliance starting on page ES-9 in the executive summary and Section 5 of the report.
All data in this report for model years 1975 through 2022 are final and based on official data submitted to EPA and NHTSA as part of the regulatory process. In some cases, this report will show data for model year 2023, which are preliminary and based on data provided to EPA by manufacturers prior to the model year. These preliminary data include projected production volumes, which may change significantly before being finalized. This report reflects the current light-duty GHG and fuel economy regulations as finalized by EPA and NHTSA, including updated standards through model year 2026. Any applicable regulatory changes finalized by EPA and NHTSA will be included in future versions of this report. To download the full report, or to explore the data using EPA’s interactive data tools, visit the report website at www.epa.gov/automotive-trends.
**AutoInformed’s Executive Summary of the 2022 Report
- New vehicle carbon dioxide emissions and fuel economy had the biggest annual improvement of the last nine years, reaching record low CO2 emissions and record high fuel economy.
- From MY 2021-22, average fuel economy increased by 0.6 mpg, which is more than double the annual rate of improvement in fuel economy over the last decade.
- Most vehicle types are at their best-ever fuel economy, including sport utility vehicles, which increased their fuel economy by 2.4 mpg in MY 2022.
- The average estimated real-world CO2 emission rate for all new vehicles fell by 3% to the lowest level ever reported.
- Since MY 2004, CO2 emissions have decreased 27%, and fuel economy has increased 35%.
- Electric vehicles and plug-in hybrid electric vehicles helped reduce the overall average CO2 emissions from the MY 2022 fleet by 22 grams per mile and improved fuel economy by 1.2 mpg in MY 2022.
AutoInformed on

About Ken Zino
Ken Zino, editor and publisher of AutoInformed, is a versatile auto industry participant with global experience spanning decades in print and broadcast journalism, as well as social media. He has automobile testing, marketing, public relations and communications experience. He is past president of The International Motor Press Assn, the Detroit Press Club, founding member and first President of the Automotive Press Assn. He is a member of APA, IMPA and the Midwest Automotive Press Assn.
He also brings an historical perspective while citing their contemporary relevance of the work of legendary auto writers such as Ken Purdy, Jim Dunne or Jerry Flint, or writers such as Red Smith, Mark Twain, Thomas Jefferson – all to bring perspective to a chaotic automotive universe.
Above all, decades after he first drove a car, Zino still revels in the sound of the exhaust as the throttle is blipped during a downshift and the driver’s rush that occurs when the entry, apex and exit points of a turn are smoothly and swiftly crossed. It’s the beginning of a perfect lap.
AutoInformed has an editorial philosophy that loves transportation machines of all kinds while promoting critical thinking about the future use of cars and trucks.
Zino builds AutoInformed from his background in automotive journalism starting at Hearst Publishing in New York City on Motor and MotorTech Magazines and car testing where he reviewed hundreds of vehicles in his decade-long stint as the Detroit Bureau Chief of Road & Track magazine. Zino has also worked in Europe, and Asia – now the largest automotive market in the world with China at its center.


US Fuel Economy at Record Highs. CO2 at Record Low
Click for more data and to enlarge.
The US. Environmental Protection Agency just before this Christmas past released its annual Automotive Trends Report.* It said that model year 2022 vehicle fuel economy reached a record high, while emission levels dropped to record low levels. The report also shows that through the MY 2022 reporting period, all 14 large manufacturers are in compliance with the light-duty greenhouse gas program requirements. This welcome news is rooted in the awakened environmental policies of the Obama and Biden Administrations.**
“As the United States accelerates towards a clean transportation future, today’s report highlights the historic progress made so far by the industry to reduce climate pollution and other harmful emissions,” said EPA Administrator Michael S. Regan. “We are thrilled to see manufacturers continue to innovate and develop technologies in multiple vehicle categories that have led to a substantial increase in miles per gallon, passing cost savings onto families across the nation.”
Following are Key Points of the EPA 2022 Report edited for Clarity
Manufacturers Continue to Use Various Advanced Technologies: “Innovation in the automobile industry has led to a wide array of technology available to manufacturers to achieve CO2 emissions, fuel economy, and performance goals. (Figure ES-5 illustrates manufacturer-specific technology usage for model year 2022, with larger circles representing higher usage rates.) The technologies in Figure ES-5 are all being used by manufacturers to, in part, reduce CO2 emissions and increase fuel economy. Each of the fourteen largest manufacturers have adopted several of these technologies into their vehicles, with many manufacturers achieving very high penetrations of several technologies. It is also clear that manufacturers’ strategies to develop and adopt new technologies are unique and vary significantly. Each manufacturer is choosing technologies that best meet the design requirements of their vehicles, and in many cases, that technology is changing quickly.
Click for more data and enlarge.
“Engine technologies such as turbocharged engines (Turbo) and gasoline direct injection (GDI) allow for more efficient engine design and operation. A growing number of engines can use GDI or port fuel injection (GDPI) depending on conditions – these engines are included with GDI engines in Figure ES-5 for the first time this year. Cylinder deactivation (CD) allows for use of only a portion of the engine when less power is needed, while stop/start systems can turn off the engine entirely at idle to save fuel. Hybrid vehicles use a larger battery to recapture braking energy and provide power when necessary, allowing for a smaller, more efficiently operated engine. The hybrid category includes “strong” hybrid systems that can temporarily power the vehicle without engaging the engine and smaller “mild” hybrid systems that cannot propel the vehicle on their own. Transmissions that have more gear ratios, or speeds, allow the engine to more frequently operate near peak efficiency. Two categories of advanced transmissions are shown in Figure ES-5: transmissions with seven or more discrete speeds (7+Gears), and continuously variable transmissions (CVTs).
“In model year 2022, hybrid vehicles reached a new high of 10% of all production. Strong and mild hybrid production grew, with mild hybrids accounting for 41% of overall hybrid production. The combined category of electric vehicles (EVs), plug-in hybrid vehicles (PHEVs), and fuel cell electric vehicles (FCVs) increased from 4% of production in model year 2021 to 7% of production in model year 2022 and are projected to reach 12% of production in model year 2023. This trend will likely continue as EV production is expected to grow across the industry in coming years.
Click for more data and to enlarge.
“In model year 2022, the average estimated real-world CO2 emission rate for all new vehicles fell by 10 g/mi to 337 g/mi, the lowest ever measured. Real-world fuel economy increased by 0.6 mpg to a record high 26.0 mpg. This is the largest single year improvement in CO2 emission rates and fuel economy in nine years. Since model year 2004, CO2 emissions have decreased 27%, or 123 g/mi, and fuel economy has increased 35%, or 6.7 mpg. Over that time, CO2 emissions have improved in fifteen of eighteen years. (The trends in CO2 emissions and fuel economy since 1975 are shown in Figure ES-1) Preliminary data suggest that CO2 emissions and fuel economy in model year 2023 will improve from 2022. (These data are shown in Figure ES-1 as a dot because the values are based on manufacturer projections rather than final data)
*Automotive Trends Report
Since 1975, EPA has collected data on every new light-duty vehicle model sold in the United States either from testing performed by EPA at the National Vehicle and Fuel Emissions Laboratory in Ann Arbor, Michigan, or directly from manufacturers using official EPA test procedures. These data are collected to support several national programs, including EPA criteria pollutant and GHG standards, the US Department of Transportation’s National Highway Traffic Safety Administration (NHTSA) Corporate Average Fuel Economy (CAFE) standards, and vehicle Fuel Economy and Environment labels. This expansive data set allows EPA to provide a comprehensive analysis of the automotive industry over the last 45+ years.
The carbon dioxide (CO2) emissions and fuel economy data in this report fall into one of two categories. The first is compliance data, which are measured using laboratory tests required by law for CAFE and adopted by EPA for GHG compliance. The second is estimated real-world data, which are measured using additional laboratory tests to capture a wider range of operating conditions (including hot and cold weather, higher speeds, and faster accelerations) encountered by an average driver. This report shows real-world data, except for discussions specific to GHG compliance starting on page ES-9 in the executive summary and Section 5 of the report.
All data in this report for model years 1975 through 2022 are final and based on official data submitted to EPA and NHTSA as part of the regulatory process. In some cases, this report will show data for model year 2023, which are preliminary and based on data provided to EPA by manufacturers prior to the model year. These preliminary data include projected production volumes, which may change significantly before being finalized. This report reflects the current light-duty GHG and fuel economy regulations as finalized by EPA and NHTSA, including updated standards through model year 2026. Any applicable regulatory changes finalized by EPA and NHTSA will be included in future versions of this report. To download the full report, or to explore the data using EPA’s interactive data tools, visit the report website at www.epa.gov/automotive-trends.
**AutoInformed’s Executive Summary of the 2022 Report
AutoInformed on
About Ken Zino
Ken Zino, editor and publisher of AutoInformed, is a versatile auto industry participant with global experience spanning decades in print and broadcast journalism, as well as social media. He has automobile testing, marketing, public relations and communications experience. He is past president of The International Motor Press Assn, the Detroit Press Club, founding member and first President of the Automotive Press Assn. He is a member of APA, IMPA and the Midwest Automotive Press Assn. He also brings an historical perspective while citing their contemporary relevance of the work of legendary auto writers such as Ken Purdy, Jim Dunne or Jerry Flint, or writers such as Red Smith, Mark Twain, Thomas Jefferson – all to bring perspective to a chaotic automotive universe. Above all, decades after he first drove a car, Zino still revels in the sound of the exhaust as the throttle is blipped during a downshift and the driver’s rush that occurs when the entry, apex and exit points of a turn are smoothly and swiftly crossed. It’s the beginning of a perfect lap. AutoInformed has an editorial philosophy that loves transportation machines of all kinds while promoting critical thinking about the future use of cars and trucks. Zino builds AutoInformed from his background in automotive journalism starting at Hearst Publishing in New York City on Motor and MotorTech Magazines and car testing where he reviewed hundreds of vehicles in his decade-long stint as the Detroit Bureau Chief of Road & Track magazine. Zino has also worked in Europe, and Asia – now the largest automotive market in the world with China at its center.